Target 2011 Annual Report Download - page 45
Download and view the complete annual report
Please find page 45 of the 2011 Target annual report below. You can navigate through the pages in the report by either clicking on the pages listed below, or by using the keyword search tool below to find specific information within the annual report.-
 1
1 -
2
-
3
-
4
-
5
-
6
-
7
-
8
-
9
-
10
-
11
-
12
-
13
-
14
-
15
-
16
-
17
-
18
-
19
-
20
-
21
-
22
-
23
-
24
-
25
-
26
-
27
-
28
-
29
-
30
-
31
-
32
-
33
-
34
-
 35
35 -
 36
36 -
 37
37 -
 38
38 -
 39
39 -
 40
40 -
 41
41 -
 42
42 -
 43
43 -
 44
44 -
 45
45 -
 46
46 -
 47
47 -
 48
48 -
 49
49 -
 50
50 -
 51
51 -
 52
52 -
 53
53 -
 54
54 -
 55
55 -
56
-
57
-
58
-
59
-
60
-
61
-
62
-
63
-
64
-
65
-
66
-
67
-
68
-
69
-
70
-
71
-
72
-
73
-
74
-
75
-
76
-
77
-
78
-
79
-
80
-
81
-
82
-
83
-
84
-
85
-
86
-
87
-
88
-
89
-
90
-
91
-
92
-
93
-
94
-
95
-
96
-
97
-
98
-
99
-
100
 |
 |

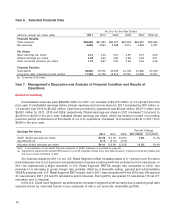
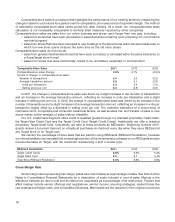
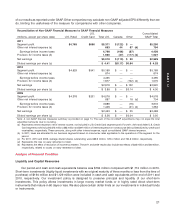
of our results as reported under GAAP. Other companies may calculate non-GAAP adjusted EPS differently than we
do, limiting the usefulness of the measure for comparisons with other companies.
Reconciliation of Non-GAAP Financial Measures to GAAP Financial Measures
U.S. Consolidated
(millions, except per share data) U.S. Retail Credit Card Total U.S. Canada Other GAAP Total
2011
Segment profit $4,765 $606 $5,371 $ (122) $ — $5,250
Other net interest expense (a) 663 44 87 (d) 794
Earnings before income taxes 4,708 (166) (87) 4,456
Provision for income taxes (b) 1,690 (47) (117) (e) 1,527
Net earnings $3,018 $ (119) $ 30 $2,929
Diluted earnings per share (c) $ 4.41 $(0.17) $0.04 $ 4.28
2010
Segment profit $4,629 $541 $ 5,169 $ — $ — $5,169
Other net interest expense (a) 674 — — 674
Earnings before income taxes 4,495 — — 4,495
Provision for income taxes (b) 1,677 — (102) (e) 1,575
Net earnings $2,818 $ — $ 102 $2,920
Diluted earnings per share (c) $ 3.86 $ — $ 0.14 $ 4.00
2009
Segment profit $4,376 $201 $ 4,576 $ — $ — $4,576
Other net interest expense (a) 687 — 16 (d) 704
Earnings before income taxes 3,889 — (16) 3,872
Provision for income taxes (b) 1,426 — (41) (e) 1,384
Net earnings $2,463 $ — $ 25 $2,488
Diluted earnings per share (c) $ 3.26 $ — $ 0.04 $ 3.30
Note: A non-GAAP financial measures summary is provided on page 14. The sum of the non-GAAP adjustments may not equal the total
adjustment amounts due to rounding.
(a) Represents interest expense, net of interest income, not included in U.S. Credit Card segment profit. For 2011, 2010 and 2009, U.S. Credit
Card segment profit included $72 million, $83 million and $97 million of interest expense on nonrecourse debt collateralized by credit card
receivables, respectively. These amounts, along with other interest expense, equal consolidated GAAP interest expense.
(b) In 2011, taxes are allocated to our business segments based on income tax rates applicable to the operations of the segment for the
period.
(c) For 2011, 2010 and 2009, average diluted shares outstanding were 683.9 million, 729.4 million and 754.8 million, respectively.
(d) Represents the loss on early retirement of debt.
(e) Represents the effect of resolution of income tax matters. The 2011 and 2009 results also include tax effects of $32 million and $6 million,
respectively, related to losses on early retirement of debt.
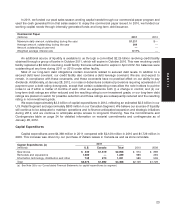
Analysis of Financial Condition
Liquidity and Capital Resources
Our period-end cash and cash equivalents balance was $794 million compared with $1,712 million in 2010.
Short-term investments (highly liquid investments with an original maturity of three months or less from the time of
purchase) of $194 million and $1,129 million were included in cash and cash equivalents at the end of 2011 and
2010, respectively. Our investment policy is designed to preserve principal and liquidity of our short-term
investments. This policy allows investments in large money market funds or in highly rated direct short-term
instruments that mature in 60 days or less. We also place certain dollar limits on our investments in individual funds
or instruments.
21
PART II