Target 2011 Annual Report Download - page 75
Download and view the complete annual report
Please find page 75 of the 2011 Target annual report below. You can navigate through the pages in the report by either clicking on the pages listed below, or by using the keyword search tool below to find specific information within the annual report.-
 1
1 -
2
-
3
-
4
-
5
-
6
-
7
-
8
-
9
-
10
-
11
-
12
-
13
-
14
-
15
-
16
-
17
-
18
-
19
-
20
-
21
-
22
-
23
-
24
-
25
-
26
-
27
-
28
-
29
-
30
-
31
-
32
-
33
-
34
-
35
-
36
-
37
-
38
-
39
-
40
-
41
-
42
-
43
-
44
-
45
-
46
-
47
-
48
-
49
-
50
-
51
-
52
-
53
-
54
-
55
-
56
-
57
-
58
-
59
-
60
-
61
-
62
-
63
-
64
-
 65
65 -
 66
66 -
 67
67 -
 68
68 -
 69
69 -
 70
70 -
 71
71 -
 72
72 -
 73
73 -
 74
74 -
 75
75 -
 76
76 -
 77
77 -
 78
78 -
 79
79 -
 80
80 -
 81
81 -
 82
82 -
 83
83 -
 84
84 -
 85
85 -
86
-
87
-
88
-
89
-
90
-
91
-
92
-
93
-
94
-
95
-
96
-
97
-
98
-
99
-
100
 |
 |

25. Share-Based Compensation
We maintain a long-term incentive plan (the Plan) for key team members and non-employee members of our
Board of Directors. Our long-term incentive plan allows us to grant equity-based compensation awards, including
stock options, stock appreciation rights, performance share units, restricted stock units, restricted stock awards or
a combination of awards (collectively, share-based awards). The number of unissued common shares reserved for
future grants under the Plan was 32.5 million at January 28, 2012 and 17.5 million at January 29, 2011.
Total share-based compensation expense recognized in the Consolidated Statements of Operations was
$90 million, $109 million and $103 million in 2011, 2010 and 2009, respectively. The related income tax benefit was
$35 million, $43 million and $40 million in 2011, 2010 and 2009, respectively.
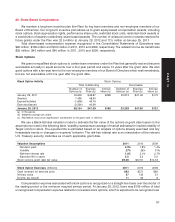
Stock Options
We grant nonqualified stock options to certain team members under the Plan that generally vest and become
exercisable annually in equal amounts over a four-year period and expire 10 years after the grant date. We also
grant options with a ten-year term to the non-employee members of our Board of Directors which vest immediately,
but are not exercisable until one year after the grant date.
Stock Option Activity Stock Options
Total Outstanding Exercisable
Number of Exercise Intrinsic Number of Exercise Intrinsic
Options (a) Price (b) Value (c) Options (a) Price (b) Value (c)
January 29, 2011 34,650 $ 46.87 $288 20,813 $47.06 $172
Granted 7,485 48.90
Expired/forfeited (1,690) 49.16
Exercised/issued (2,291) 40.38
January 28, 2012 38,154 $47.59 $166 23,283 $47.06 $121
(a) In thousands.
(b) Weighted average per share.
(c) Represents stock price appreciation subsequent to the grant date, in millions.
We use a Black-Scholes valuation model to estimate the fair value of the options at grant date based on the
assumptions noted in the following table. Volatility represents an average of market estimates for implied volatility of
Target common stock. The expected life is estimated based on an analysis of options already exercised and any
foreseeable trends or changes in recipients’ behavior. The risk-free interest rate is an interpolation of the relevant
U.S. Treasury security maturities as of each applicable grant date.
Valuation Assumptions 2011 2010 2009
Dividend yield 2.5% 1.8% 1.4%
Volatility 27% 26% 31%
Risk-free interest rate 1.0% 2.1% 2.7%
Expected life in years 5.5 5.5 5.5
Stock options grant date fair value $9.20 $12.51 $14.18
Stock Option Exercises (millions) 2011 2010 2009
Cash received for exercise price $93 $271 $62
Intrinsic value 27 132 21
Income tax benefit 11 52 8
Compensation expense associated with stock options is recognized on a straight-line basis over the shorter of
the vesting period or the minimum required service period. At January 28, 2012, there was $109 million of total
unrecognized compensation expense related to nonvested stock options, which is expected to be recognized over
51
PART II