Target 2011 Annual Report Download - page 39
Download and view the complete annual report
Please find page 39 of the 2011 Target annual report below. You can navigate through the pages in the report by either clicking on the pages listed below, or by using the keyword search tool below to find specific information within the annual report.-
 1
1 -
2
-
3
-
4
-
5
-
6
-
7
-
8
-
9
-
10
-
11
-
12
-
13
-
14
-
15
-
16
-
17
-
18
-
19
-
20
-
21
-
22
-
23
-
24
-
25
-
26
-
27
-
28
-
 29
29 -
 30
30 -
 31
31 -
 32
32 -
 33
33 -
 34
34 -
 35
35 -
 36
36 -
 37
37 -
 38
38 -
 39
39 -
 40
40 -
 41
41 -
 42
42 -
 43
43 -
 44
44 -
 45
45 -
 46
46 -
 47
47 -
 48
48 -
 49
49 -
50
-
51
-
52
-
53
-
54
-
55
-
56
-
57
-
58
-
59
-
60
-
61
-
62
-
63
-
64
-
65
-
66
-
67
-
68
-
69
-
70
-
71
-
72
-
73
-
74
-
75
-
76
-
77
-
78
-
79
-
80
-
81
-
82
-
83
-
84
-
85
-
86
-
87
-
88
-
89
-
90
-
91
-
92
-
93
-
94
-
95
-
96
-
97
-
98
-
99
-
100
 |
 |

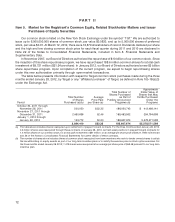
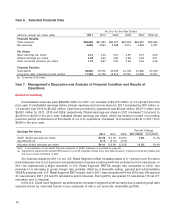
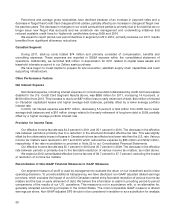
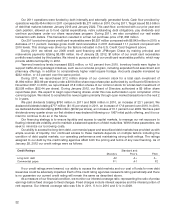
Our Canadian Segment was initially reported in our first quarter 2011 financial results, as a result of entering
into an agreement to purchase the leasehold interests in up to 220 sites in Canada operated by Zellers Inc. (Zellers).
We acquired leasehold interests in 189 Zellers sites for $1,861 million, and sold our right to acquire 54 of these sites
to third-party retailers and landlords for $225 million. These transactions resulted in a final net purchase price of
$1,636 million. We believe this transaction will allow us to open 125 to 135 Target stores in Canada, primarily during
2013. During 2011, Canadian Segment start-up costs totaled $74 million, and primarily consisted of compensation,
benefits and consulting expenses. These expenses are reported in selling, general and administrative expense
within the consolidated statement of operations.
Management’s Discussion and Analysis is based on our Consolidated Financial Statements in Item 8, Financial
Statements and Supplementary Data.
Analysis of Results of Operations
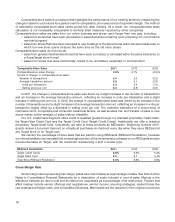
U.S. Retail Segment
Percent Change
U.S. Retail Segment Results
(millions) 2011 2010 2009 2011/2010 2010/2009
Sales $68,466 $65,786 $63,435 4.1% 3.7%
Cost of sales 47,860 45,725 44,062 4.7 3.8
Gross margin 20,606 20,061 19,373 2.7 3.5
SG&A expenses (a) 13,774 13,367 12,989 3.0 2.9
EBITDA 6,832 6,694 6,384 2.1 4.9
Depreciation and amortization 2,067 2,065 2,008 0.1 2.8
EBIT $ 4,765 $ 4,629 $ 4,376 2.9% 5.8%
EBITDA is earnings before interest expense, income taxes, depreciation and amortization.
EBIT is earnings before interest expense and income taxes.
Note: See Note 28 to our Consolidated Financial Statements for a reconciliation of our segment results to earnings before income taxes.
(a) Effective with the October 2010 nationwide launch of our 5% REDcard Rewards loyalty program, we changed the formula under which the
U.S. Retail Segment charges the U.S. Credit Card Segment to better align with the attributes of this program. Loyalty program charges
were $258 million in 2011, $102 million in 2010 and $89 million in 2009. In all periods, these amounts were recorded as reductions to
SG&A expenses within the U.S. Retail Segment and increases to operations and marketing expenses within the U.S. Credit Card
Segment.
U.S. Retail Segment Rate Analysis 2011 2010 2009
Gross margin rate 30.1% 30.5% 30.5%
SG&A expense rate 20.1 20.3 20.5
EBITDA margin rate 10.0 10.2 10.1
Depreciation and amortization expense rate 3.0 3.1 3.2
EBIT margin rate 7.0 7.0 6.9
Rate analysis metrics are computed by dividing the applicable amount by sales.
Sales
Sales include merchandise sales, net of expected returns, from our stores and our online business, as well as
gift card breakage. Refer to Note 2 of the Notes to Consolidated Financial Statements for a definition of gift card
breakage. Total sales for the U.S. Retail Segment for 2011 were $68,466 million, compared with $65,786 million in
2010 and $63,435 million in 2009. All periods were 52-week years. Growth in total sales between 2011 and 2010, as
well as between 2010 and 2009, resulted from higher comparable-store sales and additional stores opened.
Inflation did not materially affect sales during 2011 or 2010. During 2009, we experienced a deflationary impact on
sales of approximately 3.6 percentage points.
Refer to the Merchandise section in Item 1, Business, for additional product category information.
15
PART II