Target 2011 Annual Report Download - page 46
Download and view the complete annual report
Please find page 46 of the 2011 Target annual report below. You can navigate through the pages in the report by either clicking on the pages listed below, or by using the keyword search tool below to find specific information within the annual report.-
 1
1 -
2
-
3
-
4
-
5
-
6
-
7
-
8
-
9
-
10
-
11
-
12
-
13
-
14
-
15
-
16
-
17
-
18
-
19
-
20
-
21
-
22
-
23
-
24
-
25
-
26
-
27
-
28
-
29
-
30
-
31
-
32
-
33
-
34
-
35
-
 36
36 -
 37
37 -
 38
38 -
 39
39 -
 40
40 -
 41
41 -
 42
42 -
 43
43 -
 44
44 -
 45
45 -
 46
46 -
 47
47 -
 48
48 -
 49
49 -
 50
50 -
 51
51 -
 52
52 -
 53
53 -
 54
54 -
 55
55 -
 56
56 -
57
-
58
-
59
-
60
-
61
-
62
-
63
-
64
-
65
-
66
-
67
-
68
-
69
-
70
-
71
-
72
-
73
-
74
-
75
-
76
-
77
-
78
-
79
-
80
-
81
-
82
-
83
-
84
-
85
-
86
-
87
-
88
-
89
-
90
-
91
-
92
-
93
-
94
-
95
-
96
-
97
-
98
-
99
-
100
 |
 |

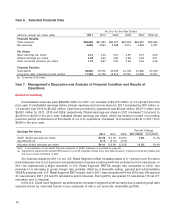
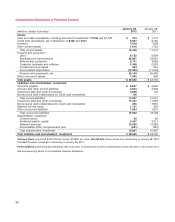
Our 2011 operations were funded by both internally and externally generated funds. Cash flow provided by
operations was $5,434 million in 2011 compared with $5,271 million in 2010. During 2011, Target issued $3.5 billion
of debt that matures between January 2013 and January 2022. This cash flow, combined with our prior year-end
cash position, allowed us to fund capital expenditures, retire outstanding debt obligations, pay dividends and
continue purchases under our share repurchase program. During 2011, we also completed our real estate
transaction with Zellers. This transaction resulted in a final net purchase price of $1,636 million.
Our 2011 period-end gross credit card receivables were $6,357 million compared with $6,843 million in 2010, a
decrease of 7.1 percent. Average gross credit card receivables in 2011 decreased 11.1 percent compared with
2010 levels. This change was driven by the factors indicated in the U.S. Credit Card Segment above.
During 2011 we retired our 2008 credit card financing with JPMorgan Chase by making principal and
make-whole payments totaling $3,080 million. As of January 28, 2012, $1 billion of our credit card receivables
portfolio was funded by third parties. We intend to pursue a sale of our credit card receivables portfolio, which may
provide additional liquidity in 2012.
Year-end inventory levels increased $322 million, or 4.2 percent from 2010. Inventory levels were higher to
support traffic-driving strategic initiatives, such as our remodel program, including expanded food assortment and
pharmacy offerings, in addition to comparatively higher retail square footage. Accounts payable increased by
$232 million, or 3.5 percent over the same period.
During 2011, we repurchased 37.2 million shares of our common stock for a total cash investment of
$1,894 million ($50.89 per share) under a $10 billion share repurchase plan authorized by our Board of Directors in
November 2007. In 2010, we repurchased 47.8 million shares of our common stock for a total cash investment of
$2,508 million ($52.44 per share). During January 2012, our Board of Directors authorized a $5 billion share
repurchase plan. We expect to begin repurchasing shares under this new authorization upon completion of the
current program. We intend to complete this new program primarily through open market transactions in the next 2
to 3 years.
We paid dividends totaling $750 million in 2011 and $609 million in 2010, an increase of 23.1 percent. We
declared dividends totaling $777 million ($1.15 per share) in 2011, an increase of 17.8 percent over 2010. In 2010,
we declared dividends totaling $659 million ($0.92 per share), an increase of 31.1 percent over 2009. We have paid
dividends every quarter since our first dividend was declared following our 1967 initial public offering, and it is our
intent to continue to do so in the future.
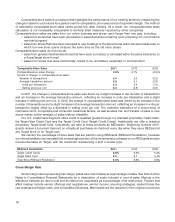
Our financing strategy is to ensure liquidity and access to capital markets, to manage our net exposure to
floating interest rate volatility, and to maintain a balanced spectrum of debt maturities. Within these parameters, we
seek to minimize our borrowing costs.
Our ability to access the long-term debt, commercial paper and securitized debt markets has provided us with
ample sources of liquidity. Our continued access to these markets depends on multiple factors including the
condition of debt capital markets, our operating performance and maintaining strong debt ratings. The ratings
assigned to our debt by the credit rating agencies affect both the pricing and terms of any new financing. As of
January 28, 2012 our credit ratings were as follows:
Standard andCredit Ratings
Moody’s Poor’s Fitch
Long-term debt A2 A+ Aǁ
Commercial paper P-1 A-1 F2
If our credit ratings were lowered, our ability to access the debt markets and our cost of funds for new debt
issuances could be adversely impacted. Each of the credit rating agencies reviews its rating periodically and there
is no guarantee our current credit rating will remain the same as described above.
As a measure of our financial condition, we monitor our interest coverage ratio, representing the ratio of pretax
earnings before fixed charges to fixed charges. Fixed charges include interest expense and the interest portion of
rent expense. Our interest coverage ratio was 5.9x in 2011, 6.1x in 2010 and 5.1x in 2009.
22