Target 2011 Annual Report Download - page 44
Download and view the complete annual report
Please find page 44 of the 2011 Target annual report below. You can navigate through the pages in the report by either clicking on the pages listed below, or by using the keyword search tool below to find specific information within the annual report.-
 1
1 -
2
-
3
-
4
-
5
-
6
-
7
-
8
-
9
-
10
-
11
-
12
-
13
-
14
-
15
-
16
-
17
-
18
-
19
-
20
-
21
-
22
-
23
-
24
-
25
-
26
-
27
-
28
-
29
-
30
-
31
-
32
-
33
-
 34
34 -
 35
35 -
 36
36 -
 37
37 -
 38
38 -
 39
39 -
 40
40 -
 41
41 -
 42
42 -
 43
43 -
 44
44 -
 45
45 -
 46
46 -
 47
47 -
 48
48 -
 49
49 -
 50
50 -
 51
51 -
 52
52 -
 53
53 -
 54
54 -
55
-
56
-
57
-
58
-
59
-
60
-
61
-
62
-
63
-
64
-
65
-
66
-
67
-
68
-
69
-
70
-
71
-
72
-
73
-
74
-
75
-
76
-
77
-
78
-
79
-
80
-
81
-
82
-
83
-
84
-
85
-
86
-
87
-
88
-
89
-
90
-
91
-
92
-
93
-
94
-
95
-
96
-
97
-
98
-
99
-
100
 |
 |
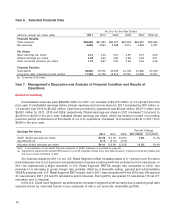
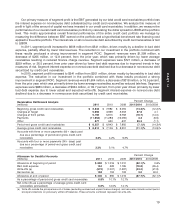
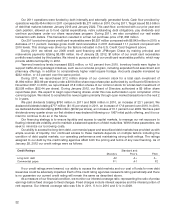
Period-end and average gross receivables have declined because of an increase in payment rates and a
decrease in Target Visa Credit Card charges at third-parties, partially offset by an increase in charges at Target over
the past two years. The decrease in charges on our credit cards at third parties is primarily due to the fact that we no
longer issue new Target Visa accounts and we undertook risk management and underwriting initiatives that
reduced available credit lines for higher-risk cardholders during 2009 and 2010.
We expect to report period-over-period declines in segment profit in 2012, primarily because our 2011 results
benefited from significant allowance reductions.
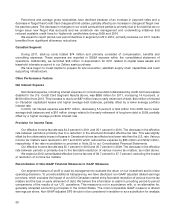
Canadian Segment
During 2011, start-up costs totaled $74 million and primarily consisted of compensation, benefits and
consulting expenses. These expenses are reported in SG&A expense within the consolidated statement of
operations. Additionally, we recorded $48 million in depreciation for 2011 related to capital lease assets and
leasehold interests acquired in our Zellers asset purchase.
We have begun to invest capital to prepare for site renovation, establish supply chain capabilities and build
supporting infrastructure.
Other Performance Factors
Net Interest Expense
Net interest expense, including interest expense on nonrecourse debt collateralized by credit card receivables
detailed in the U.S. Credit Card Segment Results above, was $866 million for 2011, increasing 14.4 percent, or
$109 million from 2010. This increase is due to an $87 million loss on early retirement of debt, $44 million of interest
on Canadian capitalized leases and higher average debt balances, partially offset by a lower average portfolio
interest rate.
In 2010, net interest expense was $757 million, decreasing 5.5 percent or $44 million from 2009 due to lower
average debt balances and a $16 million charge related to the early retirement of long-term debt in 2009, partially
offset by a higher average portfolio interest rate.
Provision for Income Taxes
Our effective income tax rate was 34.3 percent in 2011 and 35.1 percent in 2010. The decrease in the effective
rate between periods is primarily due to a reduction in the structural domestic effective tax rate. This was slightly
offset by the unfavorable impact of losses in Canada which are tax effected at a lower rate than the U.S. rate. Various
income tax matters were resolved in 2011 and 2010 which reduced tax expense by $85 million and $102 million,
respectively. A tax rate reconciliation is provided in Note 22 to our Consolidated Financial Statements.
Our effective income tax rate was 35.1 percent in 2010 and 35.7 percent in 2009. The decrease in the effective
rate between periods is primarily due to the favorable resolution of various income tax matters, as noted above.
We expect a 2012 consolidated effective income tax rate of 36.7 percent to 37.7 percent, excluding the impact
of resolution of income tax matters.
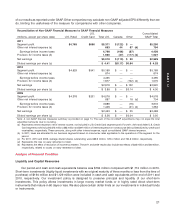
Reconciliation of Non-GAAP Financial Measures to GAAP Measures
Our segment measure of profit is used by management to evaluate the return on our investment and to make
operating decisions. To provide additional transparency, we have disclosed non-GAAP adjusted diluted earnings
per share, which excludes the impact of our 2013 Canadian market entry, favorable resolution of various income tax
matters and the loss on early retirement of debt. We believe this information is useful in providing period-to-period
comparisons of the results of our U.S. operations. This measure is not in accordance with, or an alternative for,
generally accepted accounting principles in the United States. The most comparable GAAP measure is diluted
earnings per share. Non-GAAP adjusted EPS should not be considered in isolation or as a substitution for analysis
20