Target 2011 Annual Report Download - page 56
Download and view the complete annual report
Please find page 56 of the 2011 Target annual report below. You can navigate through the pages in the report by either clicking on the pages listed below, or by using the keyword search tool below to find specific information within the annual report.-
 1
1 -
2
-
3
-
4
-
5
-
6
-
7
-
8
-
9
-
10
-
11
-
12
-
13
-
14
-
15
-
16
-
17
-
18
-
19
-
20
-
21
-
22
-
23
-
24
-
25
-
26
-
27
-
28
-
29
-
30
-
31
-
32
-
33
-
34
-
35
-
36
-
37
-
38
-
39
-
40
-
41
-
42
-
43
-
44
-
45
-
 46
46 -
 47
47 -
 48
48 -
 49
49 -
 50
50 -
 51
51 -
 52
52 -
 53
53 -
 54
54 -
 55
55 -
 56
56 -
 57
57 -
 58
58 -
 59
59 -
 60
60 -
 61
61 -
 62
62 -
 63
63 -
 64
64 -
 65
65 -
 66
66 -
67
-
68
-
69
-
70
-
71
-
72
-
73
-
74
-
75
-
76
-
77
-
78
-
79
-
80
-
81
-
82
-
83
-
84
-
85
-
86
-
87
-
88
-
89
-
90
-
91
-
92
-
93
-
94
-
95
-
96
-
97
-
98
-
99
-
100
 |
 |

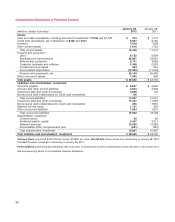
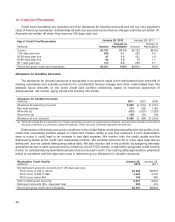
Consolidated Statements of Financial Position
January 28, January 29,
(millions, except footnotes) 2012 2011
Assets
Cash and cash equivalents, including short-term investments of $194 and $1,129 $ 794 $ 1,712
Credit card receivables, net of allowance of $430 and $690 5,927 6,153
Inventory 7,918 7,596
Other current assets 1,810 1,752
Total current assets 16,449 17,213
Property and equipment
Land 6,122 5,928
Buildings and improvements 26,837 23,081
Fixtures and equipment 5,141 4,939
Computer hardware and software 2,468 2,533
Construction-in-progress 963 567
Accumulated depreciation (12,382) (11,555)
Property and equipment, net 29,149 25,493
Other noncurrent assets 1,032 999
Total assets $ 46,630 $ 43,705
Liabilities and shareholders’ investment
Accounts payable $ 6,857 $ 6,625
Accrued and other current liabilities 3,644 3,326
Unsecured debt and other borrowings 3,036 119
Nonrecourse debt collateralized by credit card receivables 750 —
Total current liabilities 14,287 10,070
Unsecured debt and other borrowings 13,447 11,653
Nonrecourse debt collateralized by credit card receivables 250 3,954
Deferred income taxes 1,191 934
Other noncurrent liabilities 1,634 1,607
Total noncurrent liabilities 16,522 18,148
Shareholders’ investment
Common stock 56 59
Additional paid-in capital 3,487 3,311
Retained earnings 12,959 12,698
Accumulated other comprehensive loss (681) (581)
Total shareholders’ investment 15,821 15,487
Total liabilities and shareholders’ investment $ 46,630 $ 43,705
Common Stock Authorized 6,000,000,000 shares, $0.0833 par value; 669,292,929 shares issued and outstanding at January 28, 2012;
704,038,218 shares issued and outstanding at January 29, 2011.
Preferred Stock Authorized 5,000,000 shares, $0.01 par value; no shares were issued or outstanding at January 28, 2012 or January 29, 2011.
See accompanying Notes to Consolidated Financial Statements.
32