Target 2011 Annual Report Download - page 22
Download and view the complete annual report
Please find page 22 of the 2011 Target annual report below. You can navigate through the pages in the report by either clicking on the pages listed below, or by using the keyword search tool below to find specific information within the annual report.-
 1
1 -
2
-
3
-
4
-
5
-
6
-
7
-
8
-
9
-
10
-
11
-
 12
12 -
 13
13 -
 14
14 -
 15
15 -
 16
16 -
 17
17 -
 18
18 -
 19
19 -
 20
20 -
 21
21 -
 22
22 -
 23
23 -
 24
24 -
 25
25 -
 26
26 -
 27
27 -
 28
28 -
 29
29 -
 30
30 -
 31
31 -
 32
32 -
33
-
34
-
35
-
36
-
37
-
38
-
39
-
40
-
41
-
42
-
43
-
44
-
45
-
46
-
47
-
48
-
49
-
50
-
51
-
52
-
53
-
54
-
55
-
56
-
57
-
58
-
59
-
60
-
61
-
62
-
63
-
64
-
65
-
66
-
67
-
68
-
69
-
70
-
71
-
72
-
73
-
74
-
75
-
76
-
77
-
78
-
79
-
80
-
81
-
82
-
83
-
84
-
85
-
86
-
87
-
88
-
89
-
90
-
91
-
92
-
93
-
94
-
95
-
96
-
97
-
98
-
99
-
100
 |
 |

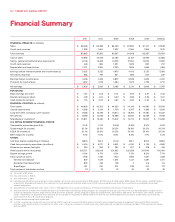
2011 2010 2009 2008 2007 2006 (a)
FINANCIAL RESULTS: (in millions)
Sales $ 68,466 $ 65,786 $ 63,435 $ 62,884 $ 61,471 $ 57,878
Credit card revenues 1,399 1,604 1,922 2,064 1,896 1,612
Total revenues 69,865 67,390 65,357 64,948 63,367 59,490
Cost of sales 47,860 45,725 44,062 44,157 42,929 40,366
Selling, general and administrative expenses (b)
14,106 13,469 13,078 12,954 12,670 11,852
Credit card expenses 446 860 1,521 1,609 837 707
Depreciationandamortization 2,131 2,084 2,023 1,826 1,659 1,496
Earnings
before interest expense and income taxes (c)
5,322 5,252 4,673 4,402 5,272 5,069
Netinterestexpense 866 757 801 866 647 572
Earningsbeforeincometaxes 4,456 4,495 3,872 3,536 4,625 4,497
Provision for income taxes 1,527 1,575 1,384 1,322 1,776 1,710
Netearnings $ 2,929 $ 2,920 $ 2,488 $ 2,214 $ 2,849 $ 2,787
PER SHARE:
Basic earnings per share $ 4.31 $ 4.03 $ 3.31 $ 2.87 $ 3.37 $ 3.23
Dilutedearningspershare $ 4.28 $ 4.00 $ 3.30 $ 2.86 $ 3.33 $ 3.21
Cash dividends declared $ 1.15 $ 0.92 $ 0.67 $ 0.62 $ 0.54 $ 0.46
FINANCIAL POSITION: (in millions)
Total assets $ 46,630 $ 43,705 $ 44,533 $ 44,106 $ 44,560 $ 37, 349
Capital expenditures $ 4,368 $ 2,129 $ 1,729 $ 3,547 $ 4,369 $ 3,928
Long-term debt, including current portion $ 17,483 $ 15,726 $ 16,814 $ 18,752 $ 17,0 90 $ 10,037
Netdebt(d) $ 17,289 $ 14,597 $ 15,288 $ 18,562 $ 15,239 $ 9,756
Shareholders’ investment $ 15,821 $ 15,487 $ 15,347 $ 13,712 $ 15,307 $ 15,633
U.S. RETAIL SEGMENT FINANCIAL RATIOS:
Comparable-store sales growth (e) 3.0% 2.1% (2.5%) (2.9%) 3.0% 4.8%
Gross margin (% of sales) 30.1% 30.5% 30.5% 29.8% 30.2% 30.3%
SG&A(%ofsales)(f) 20.1% 20.3% 20.5% 20.4% 20.4% 20.3%
EBITmargin(%ofsales) 7.0% 7.0% 6.9% 6.5% 7.1% 7.4%
OTHER:
Common shares outstanding (in millions) 669.3 704.0 744.6 752.7 818.7 859.8
Cash flow provided by operations (in millions) $ 5,434 $ 5,271 $ 5,881 $ 4,430 $ 4,125 $ 4,862
Revenues per square foot (g)(h) $ 294 $ 290 $ 287 $ 301 $ 318 $ 316
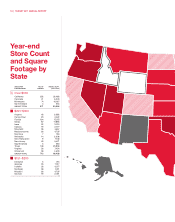
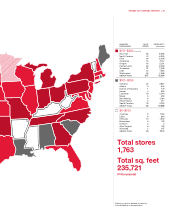
Retail square feet (in thousands) 235,721 233,618 231,952 222,588 207,945 192,064
Square footage growth 0.9% 0.7% 4.2% 7.0% 8.3% 7.7%
Total number of stores 1,763 1,750 1,740 1,682 1,591 1,488
General merchandise 637 1,037 1,381 1,441 1,381 1,311
Expandedfoodassortment 875 462 108 2 n/a n/a
SuperTarget 251 251 251 239 210 177
Total number of distribution centers 37 37 37 34 32 29
(a) Consisted of 53 weeks.
(b) AlsoreferredtoasSG&A.
(c) AlsoreferredtoasEBIT.
(d) Including current portion and short-term notes payable, net of short-term investments of $194 million, $1,129 million, $1,526 million, $190 million, $1,851 million, and $281 million,
respectively. Management believes this measure is a more appropriate indicator of our level of financial leverage because short-term investments are available to pay debt
maturity obligations.
(e) Seedefinitionofcomparable-storesalesinItem7,Management’sDiscussionandAnalysisofFinancialConditionandResultsofOperations.
(f) EffectivewiththeOctober2010nationwidelaunchofour5%REDcardRewardsloyaltyprogram,wechangedtheformulaunderwhichtheU.S.RetailSegmentchargestheU.S.
Credit Card Segment to better align with the attributes of this program. Loyalty program charges were $258 million, $102 million, $89 million, $117 million, $114 million, and $109
million,respectively.InallperiodstheseamountswererecordedasreductionstoSG&AexpenseswithintheU.S.RetailSegmentandincreasestooperationsandmarketing
expenseswithintheU.S.CreditCardSegment.
(g) Thirteen-month average retail square feet.
(h) In 2006, revenues per square foot were calculated with 52 weeks of revenues (the 53rd week of revenues was excluded) because management believes that these numbers
provideamoreusefulanalyticalcomparisontootheryears.Usingourrevenuesforthe53-weekyearundergenerallyacceptedaccountingprinciples,2006revenuespersquare
foot were $322.
Financial Summary
20 | TARGET 2011 ANNUAL REPORT