Target 2011 Annual Report Download - page 42
Download and view the complete annual report
Please find page 42 of the 2011 Target annual report below. You can navigate through the pages in the report by either clicking on the pages listed below, or by using the keyword search tool below to find specific information within the annual report.-
 1
1 -
2
-
3
-
4
-
5
-
6
-
7
-
8
-
9
-
10
-
11
-
12
-
13
-
14
-
15
-
16
-
17
-
18
-
19
-
20
-
21
-
22
-
23
-
24
-
25
-
26
-
27
-
28
-
29
-
30
-
31
-
 32
32 -
 33
33 -
 34
34 -
 35
35 -
 36
36 -
 37
37 -
 38
38 -
 39
39 -
 40
40 -
 41
41 -
 42
42 -
 43
43 -
 44
44 -
 45
45 -
 46
46 -
 47
47 -
 48
48 -
 49
49 -
 50
50 -
 51
51 -
 52
52 -
53
-
54
-
55
-
56
-
57
-
58
-
59
-
60
-
61
-
62
-
63
-
64
-
65
-
66
-
67
-
68
-
69
-
70
-
71
-
72
-
73
-
74
-
75
-
76
-
77
-
78
-
79
-
80
-
81
-
82
-
83
-
84
-
85
-
86
-
87
-
88
-
89
-
90
-
91
-
92
-
93
-
94
-
95
-
96
-
97
-
98
-
99
-
100
 |
 |

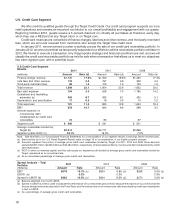
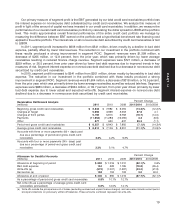
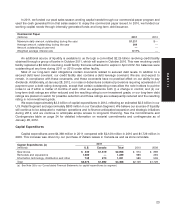
U.S. Credit Card Segment
We offer credit to qualified guests through the Target Credit Cards. Our credit card program supports our core
retail operations and remains an important contributor to our overall profitability and engagement with our guests.
Beginning October 2010, guests receive a 5 percent discount on virtually all purchases at checkout, every day,
when they use a REDcard at any Target store or on Target.com.
Credit card revenues are comprised of finance charges, late fees and other revenue, and third party merchant
fees, which are amounts received from merchants who accept the Target Visa credit card.
In January 2011, we announced our plan to actively pursue the sale of our credit card receivables portfolio. In
January 2012, we announced that we temporarily suspended our efforts to sell the receivables portfolio until later in
2012. We intend to execute a transaction only if appropriate strategic and financial conditions are met, and we will
classify the credit card receivables portfolio as held for sale when a transaction that allows us to meet our objectives
has been agreed upon with a potential buyer.
U.S Credit Card Segment
Results 2011 2010 2009
(millions) Amount Rate (d) Amount Rate (d) Amount Rate (d)
Finance charge revenue $1,131 17.9% $1,302 18.3% $1,450 17.4%
Late fees and other revenue 179 2.8 197 2.8 349 4.2
Third-party merchant fees 89 1.4 105 1.5 123 1.5
Total revenue 1,399 22.1 1,604 22.6 1,922 23.0
Bad debt expense 154 2.4 528 7.4 1,185 14.2
Operations and marketing
expenses (a) 550 8.7 433 6.1 425 5.1
Depreciation and amortization 17 0.3 19 0.3 14 0.2
Total expenses 721 11.4 980 13.8 1,624 19.4
EBIT 678 10.7 624 8.8 298 3.5
Interest expense on
nonrecourse debt
collateralized by credit card
receivables 72 83 97
Segment profit $ 606 $ 541 $ 201
Average receivables funded by
Target (b) $2,514 $2,771 $2,866
Segment pretax ROIC (c) 24.1% 19.5% 7.0%
Note: See Note 28 to our Consolidated Financial Statements for a reconciliation of our segment results to earnings before income taxes.
(a) See footnote (a) to our U.S. Retail Segment Results table on page 15 for an explanation of our loyalty program charges.
(b) Amounts represent the portion of average gross credit card receivables funded by Target. For 2011, 2010 and 2009, these amounts
exclude $3,801 million, $4,335 million and $5,484 million, respectively, of receivables funded by nonrecourse debt collateralized by credit
card receivables.
(c) ROIC is return on invested capital, and this rate equals our segment profit divided by average gross credit card receivables funded by
Target, expressed as an annualized rate.
(d) As an annualized percentage of average gross credit card receivables.
Spread Analysis – Total 2011 2010 2009
Portfolio
(millions) Amount Rate Amount Rate Amount Rate
EBIT $678 10.7% (c) $624 8.8% (c) $298 3.5% (c)
LIBOR (a) 0.2% 0.3% 0.3%
Spread to LIBOR (b) $663 10.5% (c) $604 8.5% (c) $270 3.2% (c)
(a) Balance-weighted one-month LIBOR.
(b) Spread to LIBOR is a metric used to analyze the performance of our total credit card portfolio because the majority of our portfolio earned
finance charge revenue at rates tied to the Prime Rate, and the interest rate on all nonrecourse debt securitized by credit card receivables
is tied to LIBOR.
(c) As a percentage of average gross credit card receivables.
18