APC 2014 Annual Report Download - page 10
Download and view the complete annual report
Please find page 10 of the 2014 APC annual report below. You can navigate through the pages in the report by either clicking on the pages listed below, or by using the keyword search tool below to find specific information within the annual report.-
 1
1 -
 2
2 -
 3
3 -
 4
4 -
 5
5 -
 6
6 -
 7
7 -
 8
8 -
 9
9 -
 10
10 -
 11
11 -
 12
12 -
 13
13 -
 14
14 -
 15
15 -
 16
16 -
 17
17 -
 18
18 -
 19
19 -
 20
20 -
 21
21 -
22
-
23
-
24
-
25
-
26
-
27
-
28
-
29
-
30
-
31
-
32
-
33
-
34
-
35
-
36
-
37
-
38
-
39
-
40
-
41
-
42
-
43
-
44
-
45
-
46
-
47
-
48
-
49
-
50
-
51
-
52
-
53
-
54
-
55
-
56
-
57
-
58
-
59
-
60
-
61
-
62
-
63
-
64
-
65
-
66
-
67
-
68
-
69
-
70
-
71
-
72
-
73
-
74
-
75
-
76
-
77
-
78
-
79
-
80
-
81
-
82
-
83
-
84
-
85
-
86
-
87
-
88
-
89
-
90
-
91
-
92
-
93
-
94
-
95
-
96
-
97
-
98
-
99
-
100
-
101
-
102
-
103
-
104
-
105
-
106
-
107
-
108
-
109
-
110
-
111
-
112
-
113
-
114
-
115
-
116
-
117
-
118
-
119
-
120
-
121
-
122
-
123
-
124
-
125
-
126
-
127
-
128
-
129
-
130
-
131
-
132
-
133
-
134
-
135
-
136
-
137
-
138
-
139
-
140
-
141
-
142
-
143
-
144
-
145
-
146
-
147
-
148
-
149
-
150
-
151
-
152
-
153
-
154
-
155
-
156
-
157
-
158
-
159
-
160
-
161
-
162
-
163
-
164
-
165
-
166
-
167
-
168
-
169
-
170
-
171
-
172
-
173
-
174
-
175
-
176
-
177
-
178
-
179
-
180
-
181
-
182
-
183
-
184
-
185
-
186
-
187
-
188
-
189
-
190
-
191
-
192
-
193
-
194
-
195
-
196
-
197
-
198
-
199
-
200
-
201
-
202
-
203
-
204
-
205
-
206
-
207
-
208
-
209
-
210
-
211
-
212
-
213
-
214
-
215
-
216
-
217
-
218
-
219
-
220
-
221
-
222
-
223
-
224
-
225
-
226
-
227
-
228
-
229
-
230
-
231
-
232
-
233
-
234
-
235
-
236
-
237
-
238
-
239
-
240
-
241
-
242
-
243
-
244
-
245
-
246
-
247
-
248
-
249
-
250
-
251
-
252
-
253
-
254
-
255
-
256
-
257
-
258
-
259
-
260
-
261
-
262
-
263
-
264
-
265
-
266
-
267
-
268
-
269
-
270
-
271
-
272
-
273
-
274
-
275
-
276
-
277
-
278
-
279
-
280
-
281
-
282
-
283
-
284
-
285
-
286
-
287
-
288
-
289
-
290
-
291
-
292
-
293
-
294
-
295
-
296
-
297
-
298
-
299
-
300
-
301
-
302
-
303
-
304
-
305
-
306
-
307
-
308
-
309
-
310
-
311
-
312
-
313
-
314
-
315
-
316
-
317
-
318
-
319
-
320
-
321
-
322
-
323
-
324
-
325
-
326
-
327
-
328
-
329
-
330
-
331
-
332
-
333
-
334
-
335
-
336
 |
 |

KEY FIGURES 2014
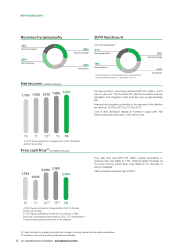
Revenue by geography 2014 headcount
19%
Rest of the World
25%
North America
28%
Western Europe
28%
Asia-Pacific
167,124 employees(1)
21%
Rest of the World
19%
North America
26%
Western Europe
34%
Asia-Pacific
(1) Spot headcount, including employees under fixed-term
and open-ended contracts, on December 31 2014
Net income (in millions of euros)
12(4)
1,793
13
1,813
10 11
1,720
14
1,941
1,888
(4) 2012 figures restated for the application of IAS 19 Revised
(pension accounting).
The Group share in net income reached EUR1,941 million, up 3%
year-on-year and 11% at constant FX. Net income before Invensys
acquisition and integration costs (post-tax) was up approximately
6%.
Invensys had a positive contribution in the decrease of the effective
tax rate from 25.5% in 2013 to 22.7% in 2014.
Cost of debt decreased despite an increase in gross debt. Net
financial expenses were down 3.5% year-on-year.
Free cash flow(2) (in millions of euros)
1,734
1,506
2,082
12(4) 13(5)
10 11 14
1,704
2,160
(4) 2012 figures restated for the application of IAS 19 Revised
(pension accounting).
(5) 2013 figures restated due to the full consolidation of Delixi
(previously consolidated proportionally at 50%), CST reclassification
in discontinued operations and other minor changes.
Free cash flow was EUR1,704 million. Capital expenditure to
revenues ratio was stable at 3.3%. Working capital increased as
the good inventory performance was offset by the decrease of
account payables.
Cash conversion remained high at 96% (3).
Cash provided by operating activities less change in working capital less net capital expenditure.(2)
based on net income exclusing discontinued activities.(3)
82014 REGISTRATION DOCUMENT SCHNEIDER ELECTRIC