APC 2014 Annual Report Download - page 200
Download and view the complete annual report
Please find page 200 of the 2014 APC annual report below. You can navigate through the pages in the report by either clicking on the pages listed below, or by using the keyword search tool below to find specific information within the annual report.-
 1
1 -
2
-
3
-
4
-
5
-
6
-
7
-
8
-
9
-
10
-
11
-
12
-
13
-
14
-
15
-
16
-
17
-
18
-
19
-
20
-
21
-
22
-
23
-
24
-
25
-
26
-
27
-
28
-
29
-
30
-
31
-
32
-
33
-
34
-
35
-
36
-
37
-
38
-
39
-
40
-
41
-
42
-
43
-
44
-
45
-
46
-
47
-
48
-
49
-
50
-
51
-
52
-
53
-
54
-
55
-
56
-
57
-
58
-
59
-
60
-
61
-
62
-
63
-
64
-
65
-
66
-
67
-
68
-
69
-
70
-
71
-
72
-
73
-
74
-
75
-
76
-
77
-
78
-
79
-
80
-
81
-
82
-
83
-
84
-
85
-
86
-
87
-
88
-
89
-
90
-
91
-
92
-
93
-
94
-
95
-
96
-
97
-
98
-
99
-
100
-
101
-
102
-
103
-
104
-
105
-
106
-
107
-
108
-
109
-
110
-
111
-
112
-
113
-
114
-
115
-
116
-
117
-
118
-
119
-
120
-
121
-
122
-
123
-
124
-
125
-
126
-
127
-
128
-
129
-
130
-
131
-
132
-
133
-
134
-
135
-
136
-
137
-
138
-
139
-
140
-
141
-
142
-
143
-
144
-
145
-
146
-
147
-
148
-
149
-
150
-
151
-
152
-
153
-
154
-
155
-
156
-
157
-
158
-
159
-
160
-
161
-
162
-
163
-
164
-
165
-
166
-
167
-
168
-
169
-
170
-
171
-
172
-
173
-
174
-
175
-
176
-
177
-
178
-
179
-
180
-
181
-
182
-
183
-
184
-
185
-
186
-
187
-
188
-
189
-
 190
190 -
 191
191 -
 192
192 -
 193
193 -
 194
194 -
 195
195 -
 196
196 -
 197
197 -
 198
198 -
 199
199 -
 200
200 -
 201
201 -
 202
202 -
 203
203 -
 204
204 -
 205
205 -
 206
206 -
 207
207 -
 208
208 -
 209
209 -
 210
210 -
211
-
212
-
213
-
214
-
215
-
216
-
217
-
218
-
219
-
220
-
221
-
222
-
223
-
224
-
225
-
226
-
227
-
228
-
229
-
230
-
231
-
232
-
233
-
234
-
235
-
236
-
237
-
238
-
239
-
240
-
241
-
242
-
243
-
244
-
245
-
246
-
247
-
248
-
249
-
250
-
251
-
252
-
253
-
254
-
255
-
256
-
257
-
258
-
259
-
260
-
261
-
262
-
263
-
264
-
265
-
266
-
267
-
268
-
269
-
270
-
271
-
272
-
273
-
274
-
275
-
276
-
277
-
278
-
279
-
280
-
281
-
282
-
283
-
284
-
285
-
286
-
287
-
288
-
289
-
290
-
291
-
292
-
293
-
294
-
295
-
296
-
297
-
298
-
299
-
300
-
301
-
302
-
303
-
304
-
305
-
306
-
307
-
308
-
309
-
310
-
311
-
312
-
313
-
314
-
315
-
316
-
317
-
318
-
319
-
320
-
321
-
322
-
323
-
324
-
325
-
326
-
327
-
328
-
329
-
330
-
331
-
332
-
333
-
334
-
335
-
336
 |
 |

5CONSOLIDATED FINANCIAL STATEMENTS AT DECEMBER31,2014
NOTES TO THE CONSOLIDATED FINANCIAL STATEMENTS
Segment information
Note3
Until 2013, Schneider Electric operations were organized in five Metals and Food & Beverages when it relates to solutions
businesses (Partner, Infrastructure, Industry, IT and Buildings), built integrating the offers of several activities from the Group;
around key technologies. IT, which covers Critical Power & Cooling Services and three
l
end-customer segments (Bank & Insurance, IT industry and
In 2014, Schneider Electric decided to regroup its Buildings and Cloud & Telecom) when it relates to solutions integrating the
Partner businesses into a single business to provide its customers offers of several activities from the Group.
a complete offer to address the buildings market. Hence, the
Group is now organized in four businesses: Buildings & Partner, Expenses concerning General Management that cannot be
Infrastructure, Industry and IT.allocated to a particular segment are presented under«Corporate
costs».
Buildings & Partner provide low voltage power and building
l
automation products and solutions that address the needs of all Operating segment data is identical to that presented to the board
end markets from buildings to industries and infrastructure to of directors, which has been identified as the main
data centers to help customers improve the energy efficiency of decision-making body for allocating resources and evaluating
the buildings; segment performance. Performance assessments used by the
board of directors are notably based on Adjusted EBITA.
Infrastructure, combines all Medium Voltage activities including
l
Share-based payment is presented under«Corporate costs». The
those from Areva Distribution, as well as Telvent; the business is board of directors does not review assets and liabilities by
in charge of the end-customer segments Oil and Gas, Electric Business.
Utilities and Transportation when it relates to solutions
integrating the offers of several activities from the Group; The same accounting principles governing the consolidated
Industry, which includes Automation & Control and four
l
financial statements apply to segment data.
end-customer segments: OEMs, Water, Mining Minerals & Details are provided in Chapter4 of the registration document
(Business Review).
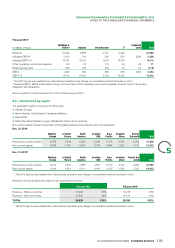
3.1– Information by operating segment
Full year 2014
Buildings & Corporate
(inmillions of euros) Industry Infrastructure IT TotalPartner costs
Revenue 10,754 5,551 5,277 3,357 - 24,939
Adjusted EBITA* 1,913 1,023 454 630 (557) 3,463
Adjusted EBITA % 17.8% 18.4% 8.6% 18.8% - 13.9%
Other operating income andexpense 7 (34) (86) 1 6 (106)
Restructuring costs (93) (26) (76) (4) (3) (202)
EBITA 1,827 963 292 627 (554) 3,155
EBITA % 17.0% 17.3% 5.5% 18.7% - 12.7%
* Adjusted EBITA: EBITA before Restructuring costs and before Other operating income and expenses (of which Costs of acquisition,
integration and separation).
Revenue related to solutions amounts to 43% of total revenue in2014.
198 2014 REGISTRATION DOCUMENT SCHNEIDER ELECTRIC