APC 2014 Annual Report Download - page 210
Download and view the complete annual report
Please find page 210 of the 2014 APC annual report below. You can navigate through the pages in the report by either clicking on the pages listed below, or by using the keyword search tool below to find specific information within the annual report.-
 1
1 -
2
-
3
-
4
-
5
-
6
-
7
-
8
-
9
-
10
-
11
-
12
-
13
-
14
-
15
-
16
-
17
-
18
-
19
-
20
-
21
-
22
-
23
-
24
-
25
-
26
-
27
-
28
-
29
-
30
-
31
-
32
-
33
-
34
-
35
-
36
-
37
-
38
-
39
-
40
-
41
-
42
-
43
-
44
-
45
-
46
-
47
-
48
-
49
-
50
-
51
-
52
-
53
-
54
-
55
-
56
-
57
-
58
-
59
-
60
-
61
-
62
-
63
-
64
-
65
-
66
-
67
-
68
-
69
-
70
-
71
-
72
-
73
-
74
-
75
-
76
-
77
-
78
-
79
-
80
-
81
-
82
-
83
-
84
-
85
-
86
-
87
-
88
-
89
-
90
-
91
-
92
-
93
-
94
-
95
-
96
-
97
-
98
-
99
-
100
-
101
-
102
-
103
-
104
-
105
-
106
-
107
-
108
-
109
-
110
-
111
-
112
-
113
-
114
-
115
-
116
-
117
-
118
-
119
-
120
-
121
-
122
-
123
-
124
-
125
-
126
-
127
-
128
-
129
-
130
-
131
-
132
-
133
-
134
-
135
-
136
-
137
-
138
-
139
-
140
-
141
-
142
-
143
-
144
-
145
-
146
-
147
-
148
-
149
-
150
-
151
-
152
-
153
-
154
-
155
-
156
-
157
-
158
-
159
-
160
-
161
-
162
-
163
-
164
-
165
-
166
-
167
-
168
-
169
-
170
-
171
-
172
-
173
-
174
-
175
-
176
-
177
-
178
-
179
-
180
-
181
-
182
-
183
-
184
-
185
-
186
-
187
-
188
-
189
-
190
-
191
-
192
-
193
-
194
-
195
-
196
-
197
-
198
-
199
-
 200
200 -
 201
201 -
 202
202 -
 203
203 -
 204
204 -
 205
205 -
 206
206 -
 207
207 -
 208
208 -
 209
209 -
 210
210 -
 211
211 -
 212
212 -
 213
213 -
 214
214 -
 215
215 -
 216
216 -
 217
217 -
 218
218 -
 219
219 -
 220
220 -
221
-
222
-
223
-
224
-
225
-
226
-
227
-
228
-
229
-
230
-
231
-
232
-
233
-
234
-
235
-
236
-
237
-
238
-
239
-
240
-
241
-
242
-
243
-
244
-
245
-
246
-
247
-
248
-
249
-
250
-
251
-
252
-
253
-
254
-
255
-
256
-
257
-
258
-
259
-
260
-
261
-
262
-
263
-
264
-
265
-
266
-
267
-
268
-
269
-
270
-
271
-
272
-
273
-
274
-
275
-
276
-
277
-
278
-
279
-
280
-
281
-
282
-
283
-
284
-
285
-
286
-
287
-
288
-
289
-
290
-
291
-
292
-
293
-
294
-
295
-
296
-
297
-
298
-
299
-
300
-
301
-
302
-
303
-
304
-
305
-
306
-
307
-
308
-
309
-
310
-
311
-
312
-
313
-
314
-
315
-
316
-
317
-
318
-
319
-
320
-
321
-
322
-
323
-
324
-
325
-
326
-
327
-
328
-
329
-
330
-
331
-
332
-
333
-
334
-
335
-
336
 |
 |

5CONSOLIDATED FINANCIAL STATEMENTS AT DECEMBER31,2014
NOTES TO THE CONSOLIDATED FINANCIAL STATEMENTS
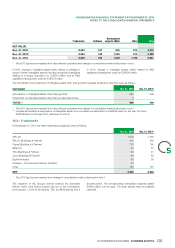
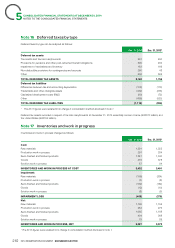
13.3 – Operating leases
Rental expense breaks down as follows:
Full year 2014 Full year 2013
Minimum rentals 163 109
Conditional rentals - -
Sub-lease rentals 7 3
TOTAL RENTAL EXPENSE 170 112
Operating lease commitments break down as follows at December31, 2014:
Discounted
Minimum minimum
payments payments
Less than one year 125 124
Between one and five years 298 287
Five years and more 117 105
TOTAL COMMITMENTS 540 516
Discounting effect (24)
Discounted minimum payments 516
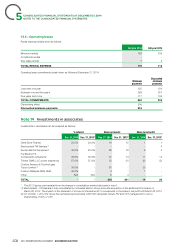
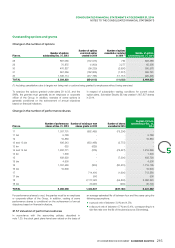
Investments in associates
Note14
Investments in associates can be analyzed as follows:
% interest Share net assets Share in net profit
Dec.31, 2014 Dec.31, 2013* Dec.31, 2014 Dec.31, 2013* Dec.31, 2014 Dec.31, 2013*
Delta Dore Finance 20.0% 20.0% 16 15 1 1
Electroshield TM Samara(1) - - - - - 4
Sunten Electric Equipment 40.0% 40.0% 88 78 6 5
Fuji Electric FA
36.8% 36.8% 91 74 11 12Components&Systems
Telvent DMS, LLC power enginering 57.0% 57.0% 32 30 (2) (2)
Custom Sensors & Technologies
30.0% - 81 - (3) -Topco Limited(2)
Foxboro Malaysia SDN. BHD. 49.0% - 4 - 1 -
Other N/A N/A 6 4 - -
TOTAL - - 318 201 14 20
The 2013 figures were restated from the change in consolidation method disclosed in note1.*
Electroshield – TM Samara is fully consolidated by Schneider Electric Group since the acquisition of the additional 50% shares on (1)
March28, 2013. The impact on the statement of income for December2013 corresponds to the share in net profit until March28, 2013.
On October1, 2014 the Group has reinvested approximately USD100m alongside Carlyle, PAI and CST management to own a (2)
shareholding of 30% of CST.
208 2014 REGISTRATION DOCUMENT SCHNEIDER ELECTRIC