APC 2014 Annual Report Download - page 69
Download and view the complete annual report
Please find page 69 of the 2014 APC annual report below. You can navigate through the pages in the report by either clicking on the pages listed below, or by using the keyword search tool below to find specific information within the annual report.-
 1
1 -
2
-
3
-
4
-
5
-
6
-
7
-
8
-
9
-
10
-
11
-
12
-
13
-
14
-
15
-
16
-
17
-
18
-
19
-
20
-
21
-
22
-
23
-
24
-
25
-
26
-
27
-
28
-
29
-
30
-
31
-
32
-
33
-
34
-
35
-
36
-
37
-
38
-
39
-
40
-
41
-
42
-
43
-
44
-
45
-
46
-
47
-
48
-
49
-
50
-
51
-
52
-
53
-
54
-
55
-
56
-
57
-
58
-
 59
59 -
 60
60 -
 61
61 -
 62
62 -
 63
63 -
 64
64 -
 65
65 -
 66
66 -
 67
67 -
 68
68 -
 69
69 -
 70
70 -
 71
71 -
 72
72 -
 73
73 -
 74
74 -
 75
75 -
 76
76 -
 77
77 -
 78
78 -
 79
79 -
80
-
81
-
82
-
83
-
84
-
85
-
86
-
87
-
88
-
89
-
90
-
91
-
92
-
93
-
94
-
95
-
96
-
97
-
98
-
99
-
100
-
101
-
102
-
103
-
104
-
105
-
106
-
107
-
108
-
109
-
110
-
111
-
112
-
113
-
114
-
115
-
116
-
117
-
118
-
119
-
120
-
121
-
122
-
123
-
124
-
125
-
126
-
127
-
128
-
129
-
130
-
131
-
132
-
133
-
134
-
135
-
136
-
137
-
138
-
139
-
140
-
141
-
142
-
143
-
144
-
145
-
146
-
147
-
148
-
149
-
150
-
151
-
152
-
153
-
154
-
155
-
156
-
157
-
158
-
159
-
160
-
161
-
162
-
163
-
164
-
165
-
166
-
167
-
168
-
169
-
170
-
171
-
172
-
173
-
174
-
175
-
176
-
177
-
178
-
179
-
180
-
181
-
182
-
183
-
184
-
185
-
186
-
187
-
188
-
189
-
190
-
191
-
192
-
193
-
194
-
195
-
196
-
197
-
198
-
199
-
200
-
201
-
202
-
203
-
204
-
205
-
206
-
207
-
208
-
209
-
210
-
211
-
212
-
213
-
214
-
215
-
216
-
217
-
218
-
219
-
220
-
221
-
222
-
223
-
224
-
225
-
226
-
227
-
228
-
229
-
230
-
231
-
232
-
233
-
234
-
235
-
236
-
237
-
238
-
239
-
240
-
241
-
242
-
243
-
244
-
245
-
246
-
247
-
248
-
249
-
250
-
251
-
252
-
253
-
254
-
255
-
256
-
257
-
258
-
259
-
260
-
261
-
262
-
263
-
264
-
265
-
266
-
267
-
268
-
269
-
270
-
271
-
272
-
273
-
274
-
275
-
276
-
277
-
278
-
279
-
280
-
281
-
282
-
283
-
284
-
285
-
286
-
287
-
288
-
289
-
290
-
291
-
292
-
293
-
294
-
295
-
296
-
297
-
298
-
299
-
300
-
301
-
302
-
303
-
304
-
305
-
306
-
307
-
308
-
309
-
310
-
311
-
312
-
313
-
314
-
315
-
316
-
317
-
318
-
319
-
320
-
321
-
322
-
323
-
324
-
325
-
326
-
327
-
328
-
329
-
330
-
331
-
332
-
333
-
334
-
335
-
336
 |
 |

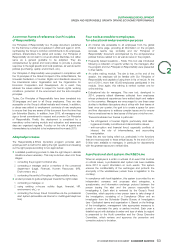
SUSTAINABLE DEVELOPMENT
SCHNEIDER ELECTRIC’S COMMITMENT TO ENVIRONMENTAL PERFORMANCE
reduce the Group’s water consumption by 10%, with specific
l
achieve an industrial waste recycling rate of greater than 85%;
l
action plans for the sites with the highest water consumption achieve 75% of product revenue from products that have a
l
and those located in areas of water stress, covering 62% of the life-cycle analysis and controlled and limited chemical substance
Group’s total consumption, and control the deviations (+/-10%) usage (Green Premium eco-mark).
of all sites that report water consumption; For this section, three key performance indicators have been set in
monitor VOC emissions (Volatile Organic Compounds) for all
l
the Planet&Society Barometer for the duration of the Connect
ISO14001 sites holding emissions permits or emitting more program (2012-2014):
than one ton per year;
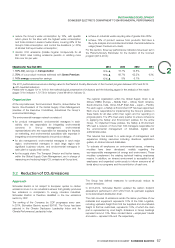
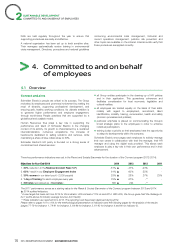
Objectives for Year-End-2014 2014 2013 2012 2011 2
1. 10% CO2 savings on transportation 16% ▲16.7% 14.8% -
2. 75% of our product revenues achieved with Green Premium 79% ▲68.7% 65.5% 63%
3. 10% energy consumption savings 13% ▲8% 6.1% -
The 2011 performance serves as a starting value for the Planet&Society Barometer of the Connect program between 2012 and 2014.
▲ 2014 audited indicators.
Please refer to pages101 to 104 for the methodological presentation of indicators and the following pages for the analysis of the results
(pages70 for indicator1,70-72 for indicator2 and 68-69 for indicator3).
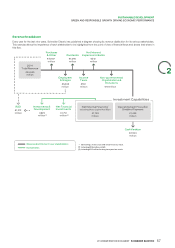
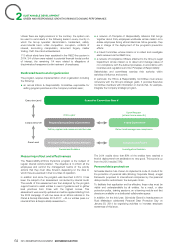
Organization
The regional organization within the Global Supply Chain is as
follows: EMEA (Europe – Middle East – Africa), North America,
At the corporate level, the Environment Director, ranked below the South America, India, China, EAJP (East Asia – Japan – Pacific).
Senior Vice-President of the Global Supply Chain Management For each region, a Safety & Environment VP has been appointed.
(member of the Executive Committee), determines the Group’s Each one is responsible for implementing the Group’s policies in
environmental strategy. these fields for all sites within their region and for reporting on
progress plans. The VPs meet every quarter to ensure coherence
The environmental manager network consists of: in applying the Safety and Environment policies for the entire
for product management: environmental managers in each
l
Group. To implement these policies, the Safety & Environment
activity who are responsible for integrating environmental VPs lead a network of more than 300managers responsible for
concerns in line-up management, environmental the environmental management of industrial, logistic and
representatives who are responsible for assessing the impacts administrative sites.
on marketing, and environmental specialists with expertise in This network has access to a wide range of management and
integrating environmental aspects into product design; experience sharing resources including directives, application
for site management: environmental managers in each major
l
guides, an intranet site and databases.
region, environmental managers in each large region with
To educate all employees on environmental issues, e-learning
significant business volume, and environmental managers in
modules have been developed, notably regarding the
each plant or supply chain center;
eco-responsible management of energy and environment. These
for the supply chain: The Transport Director and his/her teams,
l
modules complement the existing technical training employees
within the Global Supply Chain Management, are in charge of receive. In addition, an intranet environment is accessible by all
measuring and reducing freight CO2 emissions at Group level. employees and expanded continuously to inform everyone at all
levels about our programs and the contribution of each one.
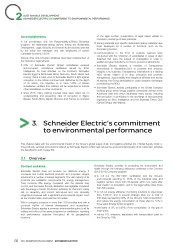
Reduction of CO2 Emissions
3.2
Approach
The Group has defined measures to continuously reduce its
carbon emissions.
Schneider Electric is not subject to European quotas on carbon In 2013-2014, Schneider Electric updated the carbon footprint
emissions since it is an industrial business that globally produces assessment performed in 2011-2012 from its upstream suppliers
few emissions in comparison to energy intensive industries. to its downstream distribution chain.
Schneider Electric is therefore classified in the low emissions
sector by CDP. The main sources of emissions remain the same: purchase of raw
materials and equipment represents 74% of the total. Logistics,
The ranking of the Company by CDP progresses every year. including upstream freight from first tier suppliers and downstream
In2014, Schneider Electric scored 99/100. The Group has been freight to first tier customers, represents 7.5%, of which the main
selected in the Climate Disclosure Leadership Index and the part is represented by road freight. Emissions in Group buildings
Climate Performance Leadership Index. represent around 10%. More modest items –employees’ travels
and waste– represent 6% and 1% respectively.
67
2014 REGISTRATION DOCUMENT SCHNEIDER ELECTRIC