APC 2014 Annual Report Download - page 78
Download and view the complete annual report
Please find page 78 of the 2014 APC annual report below. You can navigate through the pages in the report by either clicking on the pages listed below, or by using the keyword search tool below to find specific information within the annual report.-
 1
1 -
2
-
3
-
4
-
5
-
6
-
7
-
8
-
9
-
10
-
11
-
12
-
13
-
14
-
15
-
16
-
17
-
18
-
19
-
20
-
21
-
22
-
23
-
24
-
25
-
26
-
27
-
28
-
29
-
30
-
31
-
32
-
33
-
34
-
35
-
36
-
37
-
38
-
39
-
40
-
41
-
42
-
43
-
44
-
45
-
46
-
47
-
48
-
49
-
50
-
51
-
52
-
53
-
54
-
55
-
56
-
57
-
58
-
59
-
60
-
61
-
62
-
63
-
64
-
65
-
66
-
67
-
 68
68 -
 69
69 -
 70
70 -
 71
71 -
 72
72 -
 73
73 -
 74
74 -
 75
75 -
 76
76 -
 77
77 -
 78
78 -
 79
79 -
 80
80 -
 81
81 -
 82
82 -
 83
83 -
 84
84 -
 85
85 -
 86
86 -
 87
87 -
 88
88 -
89
-
90
-
91
-
92
-
93
-
94
-
95
-
96
-
97
-
98
-
99
-
100
-
101
-
102
-
103
-
104
-
105
-
106
-
107
-
108
-
109
-
110
-
111
-
112
-
113
-
114
-
115
-
116
-
117
-
118
-
119
-
120
-
121
-
122
-
123
-
124
-
125
-
126
-
127
-
128
-
129
-
130
-
131
-
132
-
133
-
134
-
135
-
136
-
137
-
138
-
139
-
140
-
141
-
142
-
143
-
144
-
145
-
146
-
147
-
148
-
149
-
150
-
151
-
152
-
153
-
154
-
155
-
156
-
157
-
158
-
159
-
160
-
161
-
162
-
163
-
164
-
165
-
166
-
167
-
168
-
169
-
170
-
171
-
172
-
173
-
174
-
175
-
176
-
177
-
178
-
179
-
180
-
181
-
182
-
183
-
184
-
185
-
186
-
187
-
188
-
189
-
190
-
191
-
192
-
193
-
194
-
195
-
196
-
197
-
198
-
199
-
200
-
201
-
202
-
203
-
204
-
205
-
206
-
207
-
208
-
209
-
210
-
211
-
212
-
213
-
214
-
215
-
216
-
217
-
218
-
219
-
220
-
221
-
222
-
223
-
224
-
225
-
226
-
227
-
228
-
229
-
230
-
231
-
232
-
233
-
234
-
235
-
236
-
237
-
238
-
239
-
240
-
241
-
242
-
243
-
244
-
245
-
246
-
247
-
248
-
249
-
250
-
251
-
252
-
253
-
254
-
255
-
256
-
257
-
258
-
259
-
260
-
261
-
262
-
263
-
264
-
265
-
266
-
267
-
268
-
269
-
270
-
271
-
272
-
273
-
274
-
275
-
276
-
277
-
278
-
279
-
280
-
281
-
282
-
283
-
284
-
285
-
286
-
287
-
288
-
289
-
290
-
291
-
292
-
293
-
294
-
295
-
296
-
297
-
298
-
299
-
300
-
301
-
302
-
303
-
304
-
305
-
306
-
307
-
308
-
309
-
310
-
311
-
312
-
313
-
314
-
315
-
316
-
317
-
318
-
319
-
320
-
321
-
322
-
323
-
324
-
325
-
326
-
327
-
328
-
329
-
330
-
331
-
332
-
333
-
334
-
335
-
336
 |
 |

2SUSTAINABLE DEVELOPMENT
COMMITTED TO AND ON BEHALF OF EMPLOYEES
Drills are held regularly throughout the year to ensure that concerning environmental crisis management, historical and
supporting procedures are ready and effective. current operations management, pollution risk prevention and
other topics are available on the intranet. Internal audits verify that
A national organization has been set up to track sensitive sites. these procedures are applied correctly.
Their managers systematically receive training in environmental
crisis management. Directives, procedures and national guidelines
Committed to and on behalf
4.
ofemployees
Overview
4.1
Context and aims
all Group entities participate in the drawing up of HR policies
l
and in their application. This guarantees coherence and
Schneider Electric’s people are critical to its success. The Group facilitates consideration for local economic, legislative and
motivates its employees and promotes involvement by making the cultural realities;
most of diversity, supporting professional development, and all employees are treated equally on the basis of their skills,
l
ensuring safe, healthy working conditions. Its ultimate ambition is notably with regard to employment, recruitment, talent
to generate higher performance and employee engagement, identification, mobility, training, remuneration, health and safety
through world-class People practices that are supported by a (common processes and policies);
global/local and scalable model. particular emphasis is placed on communicating the Group’s
l
Human Resources thus plays a key role in supporting the broad strategic plans to the employees in order to enhance
performance and talent of Schneider Electric in the changing individual participation;
context of its activity. Its growth is characterized by a sustained training is also a priority so that employees have the opportunity
l
internationalization, numerous acquisitions, the increase of to adapt to developments within the company.
headcounts dedicated to selling solutions and services, while Schneider Electric encourages each employee to actively manage
maintaining a share of blue collars close to 50%. their own career in collaboration with their line manager, their HR
Schneider Electric’s HR policy is founded on a strong sense of manager and using the digital tools provided. This allows each
commitment and shared services: employee to play a key role in their own performance and in their
advancement.
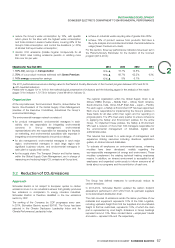
Three key performance indicators were set in the Planet and Society Barometer for the duration of the Connect program (2012-2014):
Objectives for Year-End-2014 2014 2013 2012 2011
1. 30% reduction in the Medical Incident Rate (MIR) -61% ▲-47% -23% -
2. 63%* result in our Employee Engagement Index 61% ▲60% 55% -
3. 30% women in our talent pool (~2,500people) 28% ▲28% 27% 23%
4. 1 day of training for each employee every year 79% ▲67% -** -
5. 300 sites recognized as «Cool sites»355 ▲224 -** -
The 2011 performance serves as a starting value for the Planet&Society Barometer of the Connect program between 2012 and 2014.
▲ 2014 audited indicators.
* A new target has been set from 2014 for this indicator: 63% instead of 70% at end-2014. With 63%, the Group gives itself the challenge to
be 7 points above its industry average (source: Aon Hewitt).
** These indicators are reported from 2013. The reporting tools have been deployed during 2012.
Please refer to pages101 to 104 for the methodological presentation of indicators and the following pages for the analysis of the results
(pages77-79 for indicator1, 79-81 for indicator2, 84-86 for indicator3, 81-83 for indicator4 and 80 for indicator5).
76 2014 REGISTRATION DOCUMENT SCHNEIDER ELECTRIC