APC 2014 Annual Report Download - page 172
Download and view the complete annual report
Please find page 172 of the 2014 APC annual report below. You can navigate through the pages in the report by either clicking on the pages listed below, or by using the keyword search tool below to find specific information within the annual report.-
 1
1 -
2
-
3
-
4
-
5
-
6
-
7
-
8
-
9
-
10
-
11
-
12
-
13
-
14
-
15
-
16
-
17
-
18
-
19
-
20
-
21
-
22
-
23
-
24
-
25
-
26
-
27
-
28
-
29
-
30
-
31
-
32
-
33
-
34
-
35
-
36
-
37
-
38
-
39
-
40
-
41
-
42
-
43
-
44
-
45
-
46
-
47
-
48
-
49
-
50
-
51
-
52
-
53
-
54
-
55
-
56
-
57
-
58
-
59
-
60
-
61
-
62
-
63
-
64
-
65
-
66
-
67
-
68
-
69
-
70
-
71
-
72
-
73
-
74
-
75
-
76
-
77
-
78
-
79
-
80
-
81
-
82
-
83
-
84
-
85
-
86
-
87
-
88
-
89
-
90
-
91
-
92
-
93
-
94
-
95
-
96
-
97
-
98
-
99
-
100
-
101
-
102
-
103
-
104
-
105
-
106
-
107
-
108
-
109
-
110
-
111
-
112
-
113
-
114
-
115
-
116
-
117
-
118
-
119
-
120
-
121
-
122
-
123
-
124
-
125
-
126
-
127
-
128
-
129
-
130
-
131
-
132
-
133
-
134
-
135
-
136
-
137
-
138
-
139
-
140
-
141
-
142
-
143
-
144
-
145
-
146
-
147
-
148
-
149
-
150
-
151
-
152
-
153
-
154
-
155
-
156
-
157
-
158
-
159
-
160
-
161
-
 162
162 -
 163
163 -
 164
164 -
 165
165 -
 166
166 -
 167
167 -
 168
168 -
 169
169 -
 170
170 -
 171
171 -
 172
172 -
 173
173 -
 174
174 -
 175
175 -
 176
176 -
 177
177 -
 178
178 -
 179
179 -
 180
180 -
 181
181 -
 182
182 -
183
-
184
-
185
-
186
-
187
-
188
-
189
-
190
-
191
-
192
-
193
-
194
-
195
-
196
-
197
-
198
-
199
-
200
-
201
-
202
-
203
-
204
-
205
-
206
-
207
-
208
-
209
-
210
-
211
-
212
-
213
-
214
-
215
-
216
-
217
-
218
-
219
-
220
-
221
-
222
-
223
-
224
-
225
-
226
-
227
-
228
-
229
-
230
-
231
-
232
-
233
-
234
-
235
-
236
-
237
-
238
-
239
-
240
-
241
-
242
-
243
-
244
-
245
-
246
-
247
-
248
-
249
-
250
-
251
-
252
-
253
-
254
-
255
-
256
-
257
-
258
-
259
-
260
-
261
-
262
-
263
-
264
-
265
-
266
-
267
-
268
-
269
-
270
-
271
-
272
-
273
-
274
-
275
-
276
-
277
-
278
-
279
-
280
-
281
-
282
-
283
-
284
-
285
-
286
-
287
-
288
-
289
-
290
-
291
-
292
-
293
-
294
-
295
-
296
-
297
-
298
-
299
-
300
-
301
-
302
-
303
-
304
-
305
-
306
-
307
-
308
-
309
-
310
-
311
-
312
-
313
-
314
-
315
-
316
-
317
-
318
-
319
-
320
-
321
-
322
-
323
-
324
-
325
-
326
-
327
-
328
-
329
-
330
-
331
-
332
-
333
-
334
-
335
-
336
 |
 |

4BUSINESS REVIEW
TRENDS IN SCHNEIDER ELECTRIC’S CORE MARKETS
Trends in Schneider Electric’s
1.
coremarkets
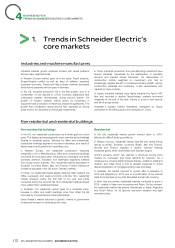
Industries and machine manufacturers
Industrial markets growth remained modest with varied positions In China, industrial production and manufacturing investment have
among major regional blocks. slowed markedly, depressed by the deterioration in domestic
demand and liquidity issues. Moreover, the deterioration of
In Western Europe market grew at a low pace. Fiscal austerity, construction activity weighted on investment and had an
Russia-Ukraine conflict as well as fears of deflation impacted increasingly negative impact on industries including metals, mining,
European economy. France and Italy industry markets decreased construction materials and machinery. It also exacerbated over
while activity expanded at low pace in Germany. capacity in heavy industry.
In the US, industrial production fell in the first quarter, due to a In Japan, industrial markets were highly impacted by April’s VAT
combination of low exports to China, inventory adjustment and hike and recorded a decline. Nevertheless, markets recovered
unfavorable weather. Nonetheless, during second quarter, the marginally at the end of the year, thanks to a rise in real exports
growth of Industry markets, mainly driven by investment in and fall of energy prices.
equipment and production of machines, improved significantly. The
growth then moderated during second half, impacted by strong Australian’s industry market decreased, hampered by Capex
dollar and by the decrease of oil and gas investments. contraction in the Mining sector and slowdown in China.
Non residential and residential buildings
Non residential buildings Residential
In the US, non residential construction as a whole grew at a slow In the US, residential market growth slowed down in 2014,
pace. The fastest growing segments were manufacturing buildings affected by difficult lending conditions.
(thanks to chemical sector), followed by office and commercial. In Western Europe, residential market was flat with varied trends
Institutional buildings segments recorded a decrease, as a result of across countries. Southern countries (Spain, Italy and France),
fiscal pressure and government spending cuts. Norway and Finland, reported a decline. German markets
In Western Europe, non residential construction improved increased gently, while Great Britain and Sweden surged.
marginally in 2014. Manufacturing, office and commercial buildings China’s property sector has reached a structural turning point
recovered at a very slow pace, hampered by oversupply and weak marked by oversupply and lower demand for property. As a
domestic demand. Education and healthcare segments suffered consequence, housing starts dropped sharply, notably in small and
from public-sector austerity. Non residential market decreased in medium size cities (Tiers 2 and 3) despite measures to boost
Southern Countries (Spain, Italy, and France). Positive framework demand (relaxation of mortgage lending rules and rates).
conditions prevailed in the UK and in German markets. In Australia, the market returned to growth after a recession in
In China, non residential market slightly declined. Main reasons are 2012 and stagnation in 2013 due to a combination of low interest
office oversupply and weak economic outlooks. Non residential rates and incentives to buy that stimulated demand for housing.
market dropped during the first half of the year and partly In other new economies, residential markets continued to grow in
recovered during the second half. Non residential buildings stayed 2014, notably in Asian new economies and Africa. On the contrary,
more resilient than residential market. the residential market has slowed dramatically in Brazil, Argentina
In Australia, non residential market grew at a moderate pace, and South Africa, hit by gloomy economic situation and tight
increase in office and health buildings more than offset the fall monetary policy.
recorded by commercial and industrial buildings.
Saudi Arabia’s market returned to growth, thanks to government
investment focused on developing new cities.
170 2014 REGISTRATION DOCUMENT SCHNEIDER ELECTRIC