APC 2014 Annual Report Download - page 211
Download and view the complete annual report
Please find page 211 of the 2014 APC annual report below. You can navigate through the pages in the report by either clicking on the pages listed below, or by using the keyword search tool below to find specific information within the annual report.-
 1
1 -
2
-
3
-
4
-
5
-
6
-
7
-
8
-
9
-
10
-
11
-
12
-
13
-
14
-
15
-
16
-
17
-
18
-
19
-
20
-
21
-
22
-
23
-
24
-
25
-
26
-
27
-
28
-
29
-
30
-
31
-
32
-
33
-
34
-
35
-
36
-
37
-
38
-
39
-
40
-
41
-
42
-
43
-
44
-
45
-
46
-
47
-
48
-
49
-
50
-
51
-
52
-
53
-
54
-
55
-
56
-
57
-
58
-
59
-
60
-
61
-
62
-
63
-
64
-
65
-
66
-
67
-
68
-
69
-
70
-
71
-
72
-
73
-
74
-
75
-
76
-
77
-
78
-
79
-
80
-
81
-
82
-
83
-
84
-
85
-
86
-
87
-
88
-
89
-
90
-
91
-
92
-
93
-
94
-
95
-
96
-
97
-
98
-
99
-
100
-
101
-
102
-
103
-
104
-
105
-
106
-
107
-
108
-
109
-
110
-
111
-
112
-
113
-
114
-
115
-
116
-
117
-
118
-
119
-
120
-
121
-
122
-
123
-
124
-
125
-
126
-
127
-
128
-
129
-
130
-
131
-
132
-
133
-
134
-
135
-
136
-
137
-
138
-
139
-
140
-
141
-
142
-
143
-
144
-
145
-
146
-
147
-
148
-
149
-
150
-
151
-
152
-
153
-
154
-
155
-
156
-
157
-
158
-
159
-
160
-
161
-
162
-
163
-
164
-
165
-
166
-
167
-
168
-
169
-
170
-
171
-
172
-
173
-
174
-
175
-
176
-
177
-
178
-
179
-
180
-
181
-
182
-
183
-
184
-
185
-
186
-
187
-
188
-
189
-
190
-
191
-
192
-
193
-
194
-
195
-
196
-
197
-
198
-
199
-
200
-
 201
201 -
 202
202 -
 203
203 -
 204
204 -
 205
205 -
 206
206 -
 207
207 -
 208
208 -
 209
209 -
 210
210 -
 211
211 -
 212
212 -
 213
213 -
 214
214 -
 215
215 -
 216
216 -
 217
217 -
 218
218 -
 219
219 -
 220
220 -
 221
221 -
222
-
223
-
224
-
225
-
226
-
227
-
228
-
229
-
230
-
231
-
232
-
233
-
234
-
235
-
236
-
237
-
238
-
239
-
240
-
241
-
242
-
243
-
244
-
245
-
246
-
247
-
248
-
249
-
250
-
251
-
252
-
253
-
254
-
255
-
256
-
257
-
258
-
259
-
260
-
261
-
262
-
263
-
264
-
265
-
266
-
267
-
268
-
269
-
270
-
271
-
272
-
273
-
274
-
275
-
276
-
277
-
278
-
279
-
280
-
281
-
282
-
283
-
284
-
285
-
286
-
287
-
288
-
289
-
290
-
291
-
292
-
293
-
294
-
295
-
296
-
297
-
298
-
299
-
300
-
301
-
302
-
303
-
304
-
305
-
306
-
307
-
308
-
309
-
310
-
311
-
312
-
313
-
314
-
315
-
316
-
317
-
318
-
319
-
320
-
321
-
322
-
323
-
324
-
325
-
326
-
327
-
328
-
329
-
330
-
331
-
332
-
333
-
334
-
335
-
336
 |
 |

CONSOLIDATED FINANCIAL STATEMENTS AT DECEMBER31,2014
NOTES TO THE CONSOLIDATED FINANCIAL STATEMENTS
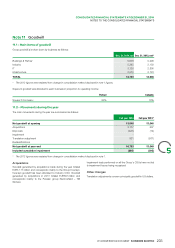
Financial assets
Note15
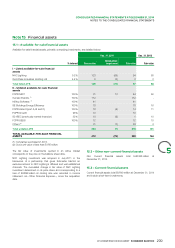
15.1 – Available-for-sale financial assets
Available-for-sale financial assets, primarily comprising investments, are detailed below:
Dec.31, 2014 Dec.31, 2013
Revaluation/
% interest Gross value Fair value Fair valueimpairment
I – Listed available-for-sale financial
assets
NVC Lighting 9.2% 123 (69) 54 60
Gold Peak Industries Holding Ltd 4.4% 6 (3) 3 3
Total listed AFS 129 (72) 57 63
II – Unlisted available-for-sale financial
assets
FCPRSEV1 100% 31 13 44 50
Gunsan Elektrik.(1) 100% 112 112 -
InStep Software.(1) 100% 41 41
SE Buildings Energy Efficiency 100% 18 18 16
FCPR Aster II (part A, B and C) 100% 18 (4) 14 11
FCPR Growth 26% 10 10
S21SEC (previously named Inversion) 35% 10 (9) 1 10
FCPR SESS 100% 12 12 10
Others(2) 31 (7) 24 4
Total unlisted AFS 283 (7) 276 101
TOTAL AVAILABLE-FOR-SALE FINANCIAL
412 (79) 333 164ASSETS
Companies purchased in2014.(1)
Gross unit value of less than EUR5million.(2)
5
The fair value of investments quoted in an active market
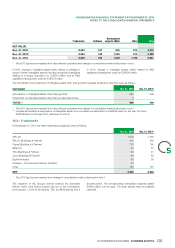
15.2 – Other non-current financial assets
corresponds to the price on the balance sheet date. Non Current financial assets total EUR365million at
NVC Lighting investment was acquired in July2011 in the December31, 2014.
framework of a partnership that gives Schneider Electric an
15.3– Current financial assets
exclusive access to NVC Lighting’s diffused and well established
channels. The cumulated change in fair value of NVC Lighting
investment determined on its price share and corresponding to a Current financial assets total EUR40million at December31, 2014
loss of EUR69million at closing rate was recorded in income and include short-term investments.
statement, as«Other Financial Expense», since the acquisition
date.
209
2014 REGISTRATION DOCUMENT SCHNEIDER ELECTRIC