APC 2014 Annual Report Download - page 117
Download and view the complete annual report
Please find page 117 of the 2014 APC annual report below. You can navigate through the pages in the report by either clicking on the pages listed below, or by using the keyword search tool below to find specific information within the annual report.-
 1
1 -
2
-
3
-
4
-
5
-
6
-
7
-
8
-
9
-
10
-
11
-
12
-
13
-
14
-
15
-
16
-
17
-
18
-
19
-
20
-
21
-
22
-
23
-
24
-
25
-
26
-
27
-
28
-
29
-
30
-
31
-
32
-
33
-
34
-
35
-
36
-
37
-
38
-
39
-
40
-
41
-
42
-
43
-
44
-
45
-
46
-
47
-
48
-
49
-
50
-
51
-
52
-
53
-
54
-
55
-
56
-
57
-
58
-
59
-
60
-
61
-
62
-
63
-
64
-
65
-
66
-
67
-
68
-
69
-
70
-
71
-
72
-
73
-
74
-
75
-
76
-
77
-
78
-
79
-
80
-
81
-
82
-
83
-
84
-
85
-
86
-
87
-
88
-
89
-
90
-
91
-
92
-
93
-
94
-
95
-
96
-
97
-
98
-
99
-
100
-
101
-
102
-
103
-
104
-
105
-
106
-
 107
107 -
 108
108 -
 109
109 -
 110
110 -
 111
111 -
 112
112 -
 113
113 -
 114
114 -
 115
115 -
 116
116 -
 117
117 -
 118
118 -
 119
119 -
 120
120 -
 121
121 -
 122
122 -
 123
123 -
 124
124 -
 125
125 -
 126
126 -
 127
127 -
128
-
129
-
130
-
131
-
132
-
133
-
134
-
135
-
136
-
137
-
138
-
139
-
140
-
141
-
142
-
143
-
144
-
145
-
146
-
147
-
148
-
149
-
150
-
151
-
152
-
153
-
154
-
155
-
156
-
157
-
158
-
159
-
160
-
161
-
162
-
163
-
164
-
165
-
166
-
167
-
168
-
169
-
170
-
171
-
172
-
173
-
174
-
175
-
176
-
177
-
178
-
179
-
180
-
181
-
182
-
183
-
184
-
185
-
186
-
187
-
188
-
189
-
190
-
191
-
192
-
193
-
194
-
195
-
196
-
197
-
198
-
199
-
200
-
201
-
202
-
203
-
204
-
205
-
206
-
207
-
208
-
209
-
210
-
211
-
212
-
213
-
214
-
215
-
216
-
217
-
218
-
219
-
220
-
221
-
222
-
223
-
224
-
225
-
226
-
227
-
228
-
229
-
230
-
231
-
232
-
233
-
234
-
235
-
236
-
237
-
238
-
239
-
240
-
241
-
242
-
243
-
244
-
245
-
246
-
247
-
248
-
249
-
250
-
251
-
252
-
253
-
254
-
255
-
256
-
257
-
258
-
259
-
260
-
261
-
262
-
263
-
264
-
265
-
266
-
267
-
268
-
269
-
270
-
271
-
272
-
273
-
274
-
275
-
276
-
277
-
278
-
279
-
280
-
281
-
282
-
283
-
284
-
285
-
286
-
287
-
288
-
289
-
290
-
291
-
292
-
293
-
294
-
295
-
296
-
297
-
298
-
299
-
300
-
301
-
302
-
303
-
304
-
305
-
306
-
307
-
308
-
309
-
310
-
311
-
312
-
313
-
314
-
315
-
316
-
317
-
318
-
319
-
320
-
321
-
322
-
323
-
324
-
325
-
326
-
327
-
328
-
329
-
330
-
331
-
332
-
333
-
334
-
335
-
336
 |
 |

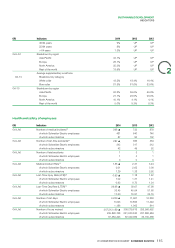
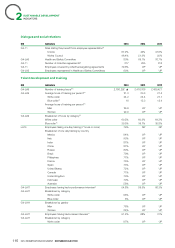
SUSTAINABLE DEVELOPMENT
INDICATORS
GRI Indicators 2014 2013 2012
45/54 years 9% UP UP
55/64 years 8% UP UP
>64 years 1.3% UP UP
G4-LA1 Breakdown by region
Asia-Pacific 34.1% UP UP
Europe 26.7% UP UP
North America 25.3% UP UP
2
Rest of the world 13.9% UP UP
Average supplementary workforce
G4-10 Breakdown by category
White collar 18.5% 18.4% 16.4%
Blue collar 81.5% 81.6% 83.6%
G4-10 Breakdown by region
Asia-Pacific 63.2% 59.6% 59.6%
Europe 21.7% 26.9% 26.9%
North America 10.1% 4.1% 4.1%
Rest of the world 5.0% 9.3% 9.3%
Health and safety of employees
GRI Indicators 2014 2013 2012
G4-LA6 Number of medical incidents(8) 568 ▲733 878
of which Schneider Electric employees 481 640 746
of which subcontractors 87 93 132
G4-LA6 Number of lost-time accidents(8) 287 ▲366 364
of which Schneider Electric employees 245 317 312
of which subcontractors 42 49 52
G4-LA6 Number of fatal accidents 1 3 1
of which Schneider Electric employees 1 3 1
of which subcontractors 0 0 0
G4-LA6 Medical Incident Rate(9) 1.85 ▲2.37 3.44
of which Schneider Electric employees 2.01 2.65 3.36
of which subcontractors 1.29 1.38 3.92
G4-LA6 Lost-Time Injury Rate (LTIR)(9) 0.93 ▲1.18 1.42
of which Schneider Electric employees 1.02 1.31 1.41
of which subcontractors 0.62 0.73 1.54
G4-LA6 Lost-Time Day Rate (LTDR)(9) 29.98 ▲38.67 47.98
of which Schneider Electric employees 33.45 45.04 51.60
of which subcontractors 17.60 15.81 24.15
G4-LA6 Number of lost days 9,209 ▲11,961 12,263
of which Schneider Electric employees 8,023 10,896 11,449
of which subcontractors 1,186 1,065 814
G4-LA6 Number of hours worked 307,213,189 ▲309,279,615 255,566,952
of which Schneider Electric employees 239,828,768 241,930,530 221,866,584
of which subcontractors 67,384,423 67,349,085 33,700,368
115
2014 REGISTRATION DOCUMENT SCHNEIDER ELECTRIC