APC 2014 Annual Report Download - page 201
Download and view the complete annual report
Please find page 201 of the 2014 APC annual report below. You can navigate through the pages in the report by either clicking on the pages listed below, or by using the keyword search tool below to find specific information within the annual report.-
 1
1 -
2
-
3
-
4
-
5
-
6
-
7
-
8
-
9
-
10
-
11
-
12
-
13
-
14
-
15
-
16
-
17
-
18
-
19
-
20
-
21
-
22
-
23
-
24
-
25
-
26
-
27
-
28
-
29
-
30
-
31
-
32
-
33
-
34
-
35
-
36
-
37
-
38
-
39
-
40
-
41
-
42
-
43
-
44
-
45
-
46
-
47
-
48
-
49
-
50
-
51
-
52
-
53
-
54
-
55
-
56
-
57
-
58
-
59
-
60
-
61
-
62
-
63
-
64
-
65
-
66
-
67
-
68
-
69
-
70
-
71
-
72
-
73
-
74
-
75
-
76
-
77
-
78
-
79
-
80
-
81
-
82
-
83
-
84
-
85
-
86
-
87
-
88
-
89
-
90
-
91
-
92
-
93
-
94
-
95
-
96
-
97
-
98
-
99
-
100
-
101
-
102
-
103
-
104
-
105
-
106
-
107
-
108
-
109
-
110
-
111
-
112
-
113
-
114
-
115
-
116
-
117
-
118
-
119
-
120
-
121
-
122
-
123
-
124
-
125
-
126
-
127
-
128
-
129
-
130
-
131
-
132
-
133
-
134
-
135
-
136
-
137
-
138
-
139
-
140
-
141
-
142
-
143
-
144
-
145
-
146
-
147
-
148
-
149
-
150
-
151
-
152
-
153
-
154
-
155
-
156
-
157
-
158
-
159
-
160
-
161
-
162
-
163
-
164
-
165
-
166
-
167
-
168
-
169
-
170
-
171
-
172
-
173
-
174
-
175
-
176
-
177
-
178
-
179
-
180
-
181
-
182
-
183
-
184
-
185
-
186
-
187
-
188
-
189
-
190
-
 191
191 -
 192
192 -
 193
193 -
 194
194 -
 195
195 -
 196
196 -
 197
197 -
 198
198 -
 199
199 -
 200
200 -
 201
201 -
 202
202 -
 203
203 -
 204
204 -
 205
205 -
 206
206 -
 207
207 -
 208
208 -
 209
209 -
 210
210 -
 211
211 -
212
-
213
-
214
-
215
-
216
-
217
-
218
-
219
-
220
-
221
-
222
-
223
-
224
-
225
-
226
-
227
-
228
-
229
-
230
-
231
-
232
-
233
-
234
-
235
-
236
-
237
-
238
-
239
-
240
-
241
-
242
-
243
-
244
-
245
-
246
-
247
-
248
-
249
-
250
-
251
-
252
-
253
-
254
-
255
-
256
-
257
-
258
-
259
-
260
-
261
-
262
-
263
-
264
-
265
-
266
-
267
-
268
-
269
-
270
-
271
-
272
-
273
-
274
-
275
-
276
-
277
-
278
-
279
-
280
-
281
-
282
-
283
-
284
-
285
-
286
-
287
-
288
-
289
-
290
-
291
-
292
-
293
-
294
-
295
-
296
-
297
-
298
-
299
-
300
-
301
-
302
-
303
-
304
-
305
-
306
-
307
-
308
-
309
-
310
-
311
-
312
-
313
-
314
-
315
-
316
-
317
-
318
-
319
-
320
-
321
-
322
-
323
-
324
-
325
-
326
-
327
-
328
-
329
-
330
-
331
-
332
-
333
-
334
-
335
-
336
 |
 |

CONSOLIDATED FINANCIAL STATEMENTS AT DECEMBER31,2014
NOTES TO THE CONSOLIDATED FINANCIAL STATEMENTS
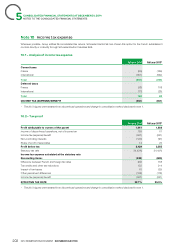
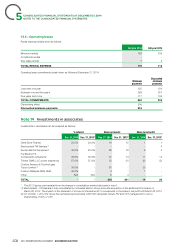
Full year 2013*
Buildings & Corporate
(inmillions of euros) Industry Infrastructure IT TotalPartner costs
Revenue 10,355 3,868 5,727 3,442 - 23,392
Adjusted EBITA** 1,926 744 562 650 (526) 3,356
Adjusted EBITA % 18.6% 19.2% 9.8% 18.9% - 14.3%
Other operating income andexpense 62 33 (17) (5) (2) 71
Restructuring costs (86) (19) (59) (7) (2) (173)
EBITA 1,902 758 486 638 (530) 3,254
EBITA % 18.4% 19.6% 8.5% 18.5% - 13.9%
* The 2013 figures were restated from discontinued operations and change in consolidation method disclosed in note1.
** Adjusted EBITA: EBITA before Restructuring costs and before Other operating income and expenses (of which Costs of acquisition,
integration and separation).
Revenue related to solutions amounts to 41% of total revenue in2013
.
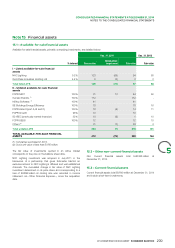
3.2– Information by region
The geographic regions covered by the Group are:
Western Europe;
l
North America: United States, Canada and Mexico;
l
Asia-Pacific;
l
Rest of the World (Eastern Europe, Middle East, Africa, South America).
l
Non-current assets include net goodwill, net intangible assets and net property, plant and equipment.
Dec.31, 2014
Western of which North of which Asia- of which Rest of
TotalEurope France America USA Pacific China the world
Revenue by country market 6,758 1,644 6,321 5,239 7,076 3,705 4,784 24,939
Non-current assets 9,848 1,761 8,981 8,748 4,544 1,532 1,172 24,545
5
Dec.31, 2013*
Western of which North of which Asia- of which Rest of the
TotalEurope France America USA Pacific China world
Revenue by country market 6,434 1,620 5,683 4,651 6,719 3,472 4,556 23,392
Non-current assets 8,094 1,851 6,311 6,091 4,185 1,390 1,333 19,923
The 2013 figures were restated from discontinued operations and change in consolidation method disclosed in note1.*
Moreover, the Group follows the share of new economies in revenue:
Full year 2014 Full year 2013*
Revenue – Mature countries 13,994 56% 13,018 56%
Revenue – New economies 10,945 44% 10,374 44%
TOTAL 24,939 100% 23,392 100%
The 2013 figures were restated from discontinued operations and change in consolidation method disclosed in note1.*
199
2014 REGISTRATION DOCUMENT SCHNEIDER ELECTRIC