APC 2014 Annual Report Download - page 112
Download and view the complete annual report
Please find page 112 of the 2014 APC annual report below. You can navigate through the pages in the report by either clicking on the pages listed below, or by using the keyword search tool below to find specific information within the annual report.-
 1
1 -
2
-
3
-
4
-
5
-
6
-
7
-
8
-
9
-
10
-
11
-
12
-
13
-
14
-
15
-
16
-
17
-
18
-
19
-
20
-
21
-
22
-
23
-
24
-
25
-
26
-
27
-
28
-
29
-
30
-
31
-
32
-
33
-
34
-
35
-
36
-
37
-
38
-
39
-
40
-
41
-
42
-
43
-
44
-
45
-
46
-
47
-
48
-
49
-
50
-
51
-
52
-
53
-
54
-
55
-
56
-
57
-
58
-
59
-
60
-
61
-
62
-
63
-
64
-
65
-
66
-
67
-
68
-
69
-
70
-
71
-
72
-
73
-
74
-
75
-
76
-
77
-
78
-
79
-
80
-
81
-
82
-
83
-
84
-
85
-
86
-
87
-
88
-
89
-
90
-
91
-
92
-
93
-
94
-
95
-
96
-
97
-
98
-
99
-
100
-
101
-
 102
102 -
 103
103 -
 104
104 -
 105
105 -
 106
106 -
 107
107 -
 108
108 -
 109
109 -
 110
110 -
 111
111 -
 112
112 -
 113
113 -
 114
114 -
 115
115 -
 116
116 -
 117
117 -
 118
118 -
 119
119 -
 120
120 -
 121
121 -
 122
122 -
123
-
124
-
125
-
126
-
127
-
128
-
129
-
130
-
131
-
132
-
133
-
134
-
135
-
136
-
137
-
138
-
139
-
140
-
141
-
142
-
143
-
144
-
145
-
146
-
147
-
148
-
149
-
150
-
151
-
152
-
153
-
154
-
155
-
156
-
157
-
158
-
159
-
160
-
161
-
162
-
163
-
164
-
165
-
166
-
167
-
168
-
169
-
170
-
171
-
172
-
173
-
174
-
175
-
176
-
177
-
178
-
179
-
180
-
181
-
182
-
183
-
184
-
185
-
186
-
187
-
188
-
189
-
190
-
191
-
192
-
193
-
194
-
195
-
196
-
197
-
198
-
199
-
200
-
201
-
202
-
203
-
204
-
205
-
206
-
207
-
208
-
209
-
210
-
211
-
212
-
213
-
214
-
215
-
216
-
217
-
218
-
219
-
220
-
221
-
222
-
223
-
224
-
225
-
226
-
227
-
228
-
229
-
230
-
231
-
232
-
233
-
234
-
235
-
236
-
237
-
238
-
239
-
240
-
241
-
242
-
243
-
244
-
245
-
246
-
247
-
248
-
249
-
250
-
251
-
252
-
253
-
254
-
255
-
256
-
257
-
258
-
259
-
260
-
261
-
262
-
263
-
264
-
265
-
266
-
267
-
268
-
269
-
270
-
271
-
272
-
273
-
274
-
275
-
276
-
277
-
278
-
279
-
280
-
281
-
282
-
283
-
284
-
285
-
286
-
287
-
288
-
289
-
290
-
291
-
292
-
293
-
294
-
295
-
296
-
297
-
298
-
299
-
300
-
301
-
302
-
303
-
304
-
305
-
306
-
307
-
308
-
309
-
310
-
311
-
312
-
313
-
314
-
315
-
316
-
317
-
318
-
319
-
320
-
321
-
322
-
323
-
324
-
325
-
326
-
327
-
328
-
329
-
330
-
331
-
332
-
333
-
334
-
335
-
336
 |
 |

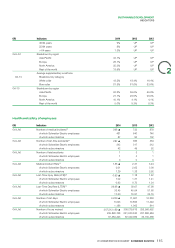
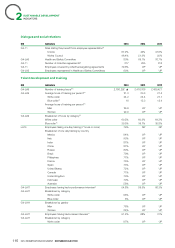
2SUSTAINABLE DEVELOPMENT
INDICATORS
Current Scope Constant Scope
GRI Indicators 2014 2013 2012 2014 2013
Water withdrawn for cooling (m3)(3)
G4-EN8 restituted w/o impact 603,876▲727,679 722,709 UP UP
G4-EN21 VOC emissions (kg) (estimates)(4) 314,258 ▲415,352 416,612 313,407 376,926
G4-EN21 VOC/employee (kg/p) (estimates) 3.0▲3.8 4.2 3.0 3.8
G4-EN3-6 Energy consumption (MWh equivalent) 1,111,359 ▲1,207,613 1,166,497 1,071,396 1,146,612
Electricity (indirect consumption) 792,793 841,495 812,917 756,346 781,394
District heating (indirect consumption) 34,815 33,122 29,255 34,171 33,122
Fuel oil (direct consumption) 8,354 22,740 22,466 8,352 20,985
Gas (direct consumption) 272,255 306,783 297,114 269,383 307,638
Coal (direct consumption) 0 3,091 4,521 0 3,091
Renewable energy (direct consumption) 3,142 382 224 3,142 382
G4-EN3-6 Energy consumption per employee (MWh) 10.7▲11.2 11.8 10.4 11.4
CO2 emissions linked to energy consumption (in t)
G4-EN15-16-19 395,110 ▲431,019 413,414 380,341 401,411(estimates)(4)
EN16 Electricity (indirect emission) 323,120 348,845 334,720 309,009 319,518
EN16 District heating (indirect emission) 14,006 12,317 10,403 13,936 12,317
EN15 Fuel oil (direct emission) 2,172 5,912 5,841 2,172 5,456
EN15 Gas (direct emission) 55,812 62,891 60,908 55,224 63,066
EN15 Coal (direct emission) 0 1,054 1,542 0 1,054
EN15 Renewable energy 0 0 0 0 0
G4-EN15-16-19 CO2 per employee (in t/p) 3.8▲4.0 4.2 3.7 4.0
G4-EN15 SF6 emissions (in CO2 equivalent t)(5) 26,069 ▲33,807 44,947 26,069 30,783
SF6 leakage rate 0.47% ▲0.56% 0.75% UP UP
Target SF6 leakage rate 0.65% 0.75% 0.95% - -
Total scope 1 CO2 emissions (direct energy
consumption and SF6 emissions in t)
G4-EN15 84,053 ▲103,664 113,238 83,465 100,359of reporting perimeter
Total scope 2 CO2 emissions (indirect energy
G4-EN16 337,126 ▲361,162 345,123 322,945 331,835consumption in t) of reporting perimeter
Total scopes 1 and 2 CO2 emissions (in t)
421,179 ▲464,826 458,361 406,410 432,194of reporting perimeter
G4-EN15-16-19 Total scopes 1 and 2/Turnover (t/€) 0.000017 0.000019 0.000019 0.000016 0.000018
▲ 2014 audited indicators.
UP =Unpublished.
2012 workforce corrected in 2013 for a major site.(1)
Estimates. Rules under finetuning.(2)
Two sites taken into account in 2012, four sites in 2013 and 2014. In2012, Schneider Electric changed methodology to distinguish the (3)
water used for consumption and water used for cooling (and restituted to the environment). Schneider Electric plans to expand this
differential reporting to all sites concerned.
From 2013, only the sites that emit more than 1,000kg of VOC per year are reporting, as well as some smaller sites on a voluntary basis.(4)
The CO2 emissions linked to energy consumption are considered estimates, because the indirect emissions are calculated on the (5)
conversion factors per country.
17sites in2012 and 2013; 16 sites in 2014.(6)
Constant scope emissions are not corrected from activity level.
110 2014 REGISTRATION DOCUMENT SCHNEIDER ELECTRIC