APC 2014 Annual Report Download - page 178
Download and view the complete annual report
Please find page 178 of the 2014 APC annual report below. You can navigate through the pages in the report by either clicking on the pages listed below, or by using the keyword search tool below to find specific information within the annual report.-
 1
1 -
2
-
3
-
4
-
5
-
6
-
7
-
8
-
9
-
10
-
11
-
12
-
13
-
14
-
15
-
16
-
17
-
18
-
19
-
20
-
21
-
22
-
23
-
24
-
25
-
26
-
27
-
28
-
29
-
30
-
31
-
32
-
33
-
34
-
35
-
36
-
37
-
38
-
39
-
40
-
41
-
42
-
43
-
44
-
45
-
46
-
47
-
48
-
49
-
50
-
51
-
52
-
53
-
54
-
55
-
56
-
57
-
58
-
59
-
60
-
61
-
62
-
63
-
64
-
65
-
66
-
67
-
68
-
69
-
70
-
71
-
72
-
73
-
74
-
75
-
76
-
77
-
78
-
79
-
80
-
81
-
82
-
83
-
84
-
85
-
86
-
87
-
88
-
89
-
90
-
91
-
92
-
93
-
94
-
95
-
96
-
97
-
98
-
99
-
100
-
101
-
102
-
103
-
104
-
105
-
106
-
107
-
108
-
109
-
110
-
111
-
112
-
113
-
114
-
115
-
116
-
117
-
118
-
119
-
120
-
121
-
122
-
123
-
124
-
125
-
126
-
127
-
128
-
129
-
130
-
131
-
132
-
133
-
134
-
135
-
136
-
137
-
138
-
139
-
140
-
141
-
142
-
143
-
144
-
145
-
146
-
147
-
148
-
149
-
150
-
151
-
152
-
153
-
154
-
155
-
156
-
157
-
158
-
159
-
160
-
161
-
162
-
163
-
164
-
165
-
166
-
167
-
 168
168 -
 169
169 -
 170
170 -
 171
171 -
 172
172 -
 173
173 -
 174
174 -
 175
175 -
 176
176 -
 177
177 -
 178
178 -
 179
179 -
 180
180 -
 181
181 -
 182
182 -
 183
183 -
 184
184 -
 185
185 -
 186
186 -
 187
187 -
 188
188 -
189
-
190
-
191
-
192
-
193
-
194
-
195
-
196
-
197
-
198
-
199
-
200
-
201
-
202
-
203
-
204
-
205
-
206
-
207
-
208
-
209
-
210
-
211
-
212
-
213
-
214
-
215
-
216
-
217
-
218
-
219
-
220
-
221
-
222
-
223
-
224
-
225
-
226
-
227
-
228
-
229
-
230
-
231
-
232
-
233
-
234
-
235
-
236
-
237
-
238
-
239
-
240
-
241
-
242
-
243
-
244
-
245
-
246
-
247
-
248
-
249
-
250
-
251
-
252
-
253
-
254
-
255
-
256
-
257
-
258
-
259
-
260
-
261
-
262
-
263
-
264
-
265
-
266
-
267
-
268
-
269
-
270
-
271
-
272
-
273
-
274
-
275
-
276
-
277
-
278
-
279
-
280
-
281
-
282
-
283
-
284
-
285
-
286
-
287
-
288
-
289
-
290
-
291
-
292
-
293
-
294
-
295
-
296
-
297
-
298
-
299
-
300
-
301
-
302
-
303
-
304
-
305
-
306
-
307
-
308
-
309
-
310
-
311
-
312
-
313
-
314
-
315
-
316
-
317
-
318
-
319
-
320
-
321
-
322
-
323
-
324
-
325
-
326
-
327
-
328
-
329
-
330
-
331
-
332
-
333
-
334
-
335
-
336
 |
 |

4BUSINESS REVIEW
REVIEW OF THE CONSOLIDATED FINANCIAL STATEMENTS
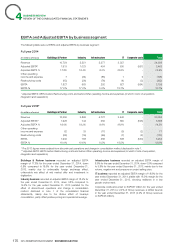
EBITA and Adjusted EBITA by business segment
The following table sets out EBITA and adjusted EBITA by business segment:
Full year 2014
(inmillions of euros) Buildings & Partner Industry Infrastructure IT Corporate costs Total
Revenue 10,754 5,551 5,277 3,357 - 24,939
Adjusted EBITA* 1,913 1,023 454 630 (557) 3,463
Adjusted EBITA % 17.8% 18.4% 8.6% 18.8% - 13.9%
Other operating
7 (34) (86) 1 6 (106)income andexpense
Restructuring costs (93) (26) (76) (4) (3) (202)
EBITA 1,827 963 292 627 (554) 3,155
EBITA % 17.0% 17.3% 5.5% 18.7% - 12.7%
* Adjusted EBITA: EBITA before Restructuring costs and before Other operating income and expenses (of which Costs of acquisition,
integration and separation).
Full year 2013*
(inmillions of euros) Buildings & Partner Industry Infrastructure IT Corporate costs Total
Revenue 10,355 3,868 5,727 3,442 - 23,392
Adjusted EBITA** 1,926 744 562 650 (526) 3,356
Adjusted EBITA % 18.6% 19.2% 9.8% 18.9% - 14.3%
Other operating
62 33 (17) (5) (2) 71income andexpense
Restructuring costs (86) (19) (59) (7) (2) (173)
EBITA 1,902 758 486 638 (530) 3,254
EBITA % 18.4% 19.6% 8.5% 18.5% - 13.9%
* The 2013 figures were restated from discontinued operations and change in consolidation method disclosed in note1.
** Adjusted EBITA: EBITA before Restructuring costs and before Other operating income and expenses (of which Costs of acquisition,
integration and separation).
Buildings & Partner business recorded an adjusted EBITA
Infrastructure business recorded an adjusted EBITA margin of
margin of 17.8% for the year ended December31, 2014, down
8.6% for the year ended December31, 2014, down 0.8% compared
0.8% compared to18.6% for the year ended December31,
to 9.8% for the year ended December31, 2013, mainly due to low
2013, mainly due to unfavorable foreign exchange effect,
volume, negative mix and pressure on project selling price.
unfavorable mix effect of mid market offer and investment in IT business reported an adjusted EBITA margin of 18.8% for the
digitization. year ended December31, 2014, stable with 18.9% margin for the
Industry business recorded an adjusted EBITA margin of 18.4% for
year ended December31, 2013, showing resilience in a low
the year ended December31, 2014, down 0.8% compared to
growth environment.
19.2% for the year ended December31, 2013 (restated for the
Corporate costs amounted to EUR557million for the year ended
effect of discontinued operations and change in consolidation
December31, 2014 or 2.2% of Group revenues, a similar level as
method disclosed in note 1 of the consolidated financial
in the year ended December31, 2013 (2.2% of Group revenues
statements), mainly due to the dilutive effect of Invensys
or EUR526million).
consolidation, partly offset positive pricing and operational leverage.
176 2014 REGISTRATION DOCUMENT SCHNEIDER ELECTRIC