APC 2014 Annual Report Download - page 176
Download and view the complete annual report
Please find page 176 of the 2014 APC annual report below. You can navigate through the pages in the report by either clicking on the pages listed below, or by using the keyword search tool below to find specific information within the annual report.-
 1
1 -
2
-
3
-
4
-
5
-
6
-
7
-
8
-
9
-
10
-
11
-
12
-
13
-
14
-
15
-
16
-
17
-
18
-
19
-
20
-
21
-
22
-
23
-
24
-
25
-
26
-
27
-
28
-
29
-
30
-
31
-
32
-
33
-
34
-
35
-
36
-
37
-
38
-
39
-
40
-
41
-
42
-
43
-
44
-
45
-
46
-
47
-
48
-
49
-
50
-
51
-
52
-
53
-
54
-
55
-
56
-
57
-
58
-
59
-
60
-
61
-
62
-
63
-
64
-
65
-
66
-
67
-
68
-
69
-
70
-
71
-
72
-
73
-
74
-
75
-
76
-
77
-
78
-
79
-
80
-
81
-
82
-
83
-
84
-
85
-
86
-
87
-
88
-
89
-
90
-
91
-
92
-
93
-
94
-
95
-
96
-
97
-
98
-
99
-
100
-
101
-
102
-
103
-
104
-
105
-
106
-
107
-
108
-
109
-
110
-
111
-
112
-
113
-
114
-
115
-
116
-
117
-
118
-
119
-
120
-
121
-
122
-
123
-
124
-
125
-
126
-
127
-
128
-
129
-
130
-
131
-
132
-
133
-
134
-
135
-
136
-
137
-
138
-
139
-
140
-
141
-
142
-
143
-
144
-
145
-
146
-
147
-
148
-
149
-
150
-
151
-
152
-
153
-
154
-
155
-
156
-
157
-
158
-
159
-
160
-
161
-
162
-
163
-
164
-
165
-
 166
166 -
 167
167 -
 168
168 -
 169
169 -
 170
170 -
 171
171 -
 172
172 -
 173
173 -
 174
174 -
 175
175 -
 176
176 -
 177
177 -
 178
178 -
 179
179 -
 180
180 -
 181
181 -
 182
182 -
 183
183 -
 184
184 -
 185
185 -
 186
186 -
187
-
188
-
189
-
190
-
191
-
192
-
193
-
194
-
195
-
196
-
197
-
198
-
199
-
200
-
201
-
202
-
203
-
204
-
205
-
206
-
207
-
208
-
209
-
210
-
211
-
212
-
213
-
214
-
215
-
216
-
217
-
218
-
219
-
220
-
221
-
222
-
223
-
224
-
225
-
226
-
227
-
228
-
229
-
230
-
231
-
232
-
233
-
234
-
235
-
236
-
237
-
238
-
239
-
240
-
241
-
242
-
243
-
244
-
245
-
246
-
247
-
248
-
249
-
250
-
251
-
252
-
253
-
254
-
255
-
256
-
257
-
258
-
259
-
260
-
261
-
262
-
263
-
264
-
265
-
266
-
267
-
268
-
269
-
270
-
271
-
272
-
273
-
274
-
275
-
276
-
277
-
278
-
279
-
280
-
281
-
282
-
283
-
284
-
285
-
286
-
287
-
288
-
289
-
290
-
291
-
292
-
293
-
294
-
295
-
296
-
297
-
298
-
299
-
300
-
301
-
302
-
303
-
304
-
305
-
306
-
307
-
308
-
309
-
310
-
311
-
312
-
313
-
314
-
315
-
316
-
317
-
318
-
319
-
320
-
321
-
322
-
323
-
324
-
325
-
326
-
327
-
328
-
329
-
330
-
331
-
332
-
333
-
334
-
335
-
336
 |
 |

4BUSINESS REVIEW
REVIEW OF THE CONSOLIDATED FINANCIAL STATEMENTS
increase towards year-end due to inventory build-up from However the business started to improve towards the end of the
customers anticipating further currency depreciation. year. North America was strong in the year thanks to data center
and oil & gas investment. Asia-Pacific saw mixed trends, with
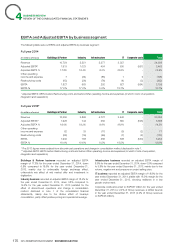
The Industry business generated revenues of EUR5,551million, growth in oil & gas projects in Australia while China and South-East
or 22% of the consolidated total. This represents an increase of Asia were slightly down. The Rest of the World was impacted by
+43.5% on a reported basis and an increase of +4.3% on a Africa and South America. Services grew double digit.
like-for-like basis. The business posted growth across regions,
driven by strong installed base services and solid OEM demand. The IT business generated revenues of EUR3,357million, or 14%
Growth in Western Europe was driven by export-oriented OEMs. of the consolidated total. This represents a decrease of -2.5% on a
North America benefited over the year from oil & gas investment reported basis and an increase of +1.1% on a like-for-like basis.
and a solid OEM market, but observed a slowdown at the end of Western Europe drove growth thanks to IT investment and
the year. In Asia-Pacific, South East Asia was robust, China commercial success. In North America, investment in large and
declined in the second half of the year and mining remained weak extra-large data centers benefited the total Group’s business,
in Australia. The Rest of the World was strong. including low and medium voltage offer. The region saw an
improvement in demand for small to medium sized data centers at
The Infrastructure business generated revenues of year-end. Asia-Pacific saw slight growth. Demand in Russia
EUR5,277million, or 21% of the consolidated total. This declined and the business was penalized by distributor destocking
represents a decrease of -7.8% on a reported basis and a over the year. Services continued to perform well.
decrease of -4.4% on a like-for-like basis. The decline was mainly
due to the persistently weak utility market in Western Europe.
Gross profit
Gross profit increased from EUR8,763million for the year ended productivity, partially offset by unfavorable effect of foreign
December31, 2013 (restated for the effect of discontinued exchange. As a percentage of revenues, the gross margin
operations and change in consolidation method disclosed in note 1 increased to 37.7% in 2014 (versus 37.5% in 2013), driven by
of the consolidated financial statements) to EUR9,407million for productivity and Invensys contribution, despite unfavorable foreign
the year ended December31, 2014, or +7.3%, mainly due to exchange effect.
Invensys acquisition from January 2014 (+8.5%) and an increase in
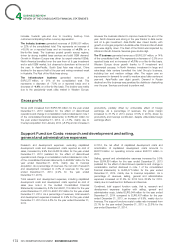
Support Function Costs: research and development and selling,
generalandadministrative expenses
Research and development expenses, excluding capitalized In2014, the net effect of capitalized development costs and
development costs and development costs reported as cost of amortization of capitalized development costs amounts to
sales, increased by 9.9% from EUR516million for the year ended EUR175million on operating income versus EUR173 million in
December31, 2013 (restated for the effect of discontinued 2013.
operations and change in consolidation method disclosed in note 1 Selling, general and administrative expenses increased by 9.9%
of the consolidated financial statements) to EUR567million for the from EUR4,891million for the year ended December31, 2013
year ended December31, 2014, mainly due to Invensys (restated for the effect of discontinued operations and change in
acquisition. As a percentage of revenues, the net cost of research consolidation method disclosed in note 1 of the consolidated
and development increased to 2.3% of revenues for the year financial statements) to EUR5,377million for the year ended
ended December31, 2014 (2.2% for the year ended December31, 2014, mainly due to Invensys acquisition. As a
December31, 2013). percentage of revenues, selling, general and administrative
Total research and development expenses, including capitalized expenses increased at 21.6% for 2014 from 20.9% for 2013,
development costs and development costs reported as cost of mainly due to investments in Software and Services.
sales (see note4 to the Audited Consolidated Financial Combined, total support function costs, that is, research and
Statements) increased by 8.3% from EUR1,119million for the year development expenses together with selling, general and
ended December31, 2013 to EUR1,212million for the year ended administrative costs, totaled EUR5,944million for the year ended
December31, 2014. As a percentage of revenues, total research December31, 2014 compared to EUR5,407million for the year
and development expenses increased to 4.9% for the year ended ended December31, 2013, an increase of 9.9%, mainly due to
December31, 2014 from 4.8% for the year ended December31, Invensys. The support functions costs to sales ratio increased from
2013. 23.1% for the year ended December31, 2013 to 23.8% for the
year ended December31, 2014.
174 2014 REGISTRATION DOCUMENT SCHNEIDER ELECTRIC