APC 2014 Annual Report Download - page 212
Download and view the complete annual report
Please find page 212 of the 2014 APC annual report below. You can navigate through the pages in the report by either clicking on the pages listed below, or by using the keyword search tool below to find specific information within the annual report.-
 1
1 -
2
-
3
-
4
-
5
-
6
-
7
-
8
-
9
-
10
-
11
-
12
-
13
-
14
-
15
-
16
-
17
-
18
-
19
-
20
-
21
-
22
-
23
-
24
-
25
-
26
-
27
-
28
-
29
-
30
-
31
-
32
-
33
-
34
-
35
-
36
-
37
-
38
-
39
-
40
-
41
-
42
-
43
-
44
-
45
-
46
-
47
-
48
-
49
-
50
-
51
-
52
-
53
-
54
-
55
-
56
-
57
-
58
-
59
-
60
-
61
-
62
-
63
-
64
-
65
-
66
-
67
-
68
-
69
-
70
-
71
-
72
-
73
-
74
-
75
-
76
-
77
-
78
-
79
-
80
-
81
-
82
-
83
-
84
-
85
-
86
-
87
-
88
-
89
-
90
-
91
-
92
-
93
-
94
-
95
-
96
-
97
-
98
-
99
-
100
-
101
-
102
-
103
-
104
-
105
-
106
-
107
-
108
-
109
-
110
-
111
-
112
-
113
-
114
-
115
-
116
-
117
-
118
-
119
-
120
-
121
-
122
-
123
-
124
-
125
-
126
-
127
-
128
-
129
-
130
-
131
-
132
-
133
-
134
-
135
-
136
-
137
-
138
-
139
-
140
-
141
-
142
-
143
-
144
-
145
-
146
-
147
-
148
-
149
-
150
-
151
-
152
-
153
-
154
-
155
-
156
-
157
-
158
-
159
-
160
-
161
-
162
-
163
-
164
-
165
-
166
-
167
-
168
-
169
-
170
-
171
-
172
-
173
-
174
-
175
-
176
-
177
-
178
-
179
-
180
-
181
-
182
-
183
-
184
-
185
-
186
-
187
-
188
-
189
-
190
-
191
-
192
-
193
-
194
-
195
-
196
-
197
-
198
-
199
-
200
-
201
-
 202
202 -
 203
203 -
 204
204 -
 205
205 -
 206
206 -
 207
207 -
 208
208 -
 209
209 -
 210
210 -
 211
211 -
 212
212 -
 213
213 -
 214
214 -
 215
215 -
 216
216 -
 217
217 -
 218
218 -
 219
219 -
 220
220 -
 221
221 -
 222
222 -
223
-
224
-
225
-
226
-
227
-
228
-
229
-
230
-
231
-
232
-
233
-
234
-
235
-
236
-
237
-
238
-
239
-
240
-
241
-
242
-
243
-
244
-
245
-
246
-
247
-
248
-
249
-
250
-
251
-
252
-
253
-
254
-
255
-
256
-
257
-
258
-
259
-
260
-
261
-
262
-
263
-
264
-
265
-
266
-
267
-
268
-
269
-
270
-
271
-
272
-
273
-
274
-
275
-
276
-
277
-
278
-
279
-
280
-
281
-
282
-
283
-
284
-
285
-
286
-
287
-
288
-
289
-
290
-
291
-
292
-
293
-
294
-
295
-
296
-
297
-
298
-
299
-
300
-
301
-
302
-
303
-
304
-
305
-
306
-
307
-
308
-
309
-
310
-
311
-
312
-
313
-
314
-
315
-
316
-
317
-
318
-
319
-
320
-
321
-
322
-
323
-
324
-
325
-
326
-
327
-
328
-
329
-
330
-
331
-
332
-
333
-
334
-
335
-
336
 |
 |

5CONSOLIDATED FINANCIAL STATEMENTS AT DECEMBER31,2014
NOTES TO THE CONSOLIDATED FINANCIAL STATEMENTS
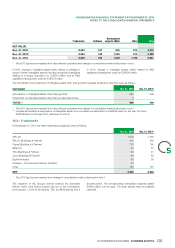
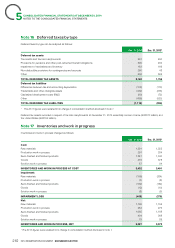
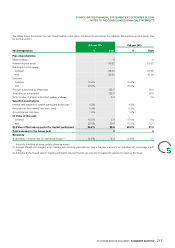
Deferred taxes by type
Note16
Deferred taxes by type can be analyzed as follows:
Dec.31, 2014 Dec.31, 2013*
Deferred tax assets
Tax credits and tax loss carryforwards 591 450
Provisions for pensions and other post-retirement benefit obligations 590 484
Impairment of receivables and inventory 183 169
Non-deductible provisions for contingencies and accruals 260 48
Other 536 605
TOTAL DEFERRED TAX ASSETS 2,160 1,756
Deferred tax liabilities
Differences between tax and accounting depreciation (108) (113)
Trademarks and other intangible assets (432) (276)
Capitalized development costs (R&D) (90) (72)
Other (486) (533)
TOTAL DEFERRED TAX LIABILITIES (1,116) (994)
The 2013 figures were restated from change in consolidation method disclosed in note1.*
Deferred tax assets recorded in respect of tax loss carryforwards at December31, 2014 essentially concern France (EUR313million) and
the United States (EUR152million).
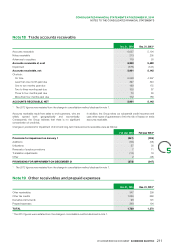
Inventories and work in progress
Note17
Inventories and work in process changed as follows:
Dec.31, 2014 Dec.31, 2013*
Cost:
Raw materials 1,391 1,355
Production work in process 291 284
Semi-finished and finished products 1,247 1,340
Goods 416 378
Solution work in process 87 94
INVENTORIES AND WORK IN PROCESS AT COST 3,432 3,451
Impairment:
Raw materials (196) (204)
Production work in process (7) (8)
Semi-finished and finished products (182) (152)
Goods (12) (10)
Solution work in process (8) (5)
IMPAIRMENT LOSS (405) (379)
Net:
Raw materials 1,195 1,155
Production work in process 284 276
Semi-finished and finished products 1,065 1,188
Goods 404 368
Solution work in process 79 89
INVENTORIES AND WORK IN PROCESS, NET 3,027 3,072
* The 2013 figures were restated from change in consolidation method disclosed in note1.
210 2014 REGISTRATION DOCUMENT SCHNEIDER ELECTRIC