APC 2014 Annual Report Download - page 115
Download and view the complete annual report
Please find page 115 of the 2014 APC annual report below. You can navigate through the pages in the report by either clicking on the pages listed below, or by using the keyword search tool below to find specific information within the annual report.-
 1
1 -
2
-
3
-
4
-
5
-
6
-
7
-
8
-
9
-
10
-
11
-
12
-
13
-
14
-
15
-
16
-
17
-
18
-
19
-
20
-
21
-
22
-
23
-
24
-
25
-
26
-
27
-
28
-
29
-
30
-
31
-
32
-
33
-
34
-
35
-
36
-
37
-
38
-
39
-
40
-
41
-
42
-
43
-
44
-
45
-
46
-
47
-
48
-
49
-
50
-
51
-
52
-
53
-
54
-
55
-
56
-
57
-
58
-
59
-
60
-
61
-
62
-
63
-
64
-
65
-
66
-
67
-
68
-
69
-
70
-
71
-
72
-
73
-
74
-
75
-
76
-
77
-
78
-
79
-
80
-
81
-
82
-
83
-
84
-
85
-
86
-
87
-
88
-
89
-
90
-
91
-
92
-
93
-
94
-
95
-
96
-
97
-
98
-
99
-
100
-
101
-
102
-
103
-
104
-
 105
105 -
 106
106 -
 107
107 -
 108
108 -
 109
109 -
 110
110 -
 111
111 -
 112
112 -
 113
113 -
 114
114 -
 115
115 -
 116
116 -
 117
117 -
 118
118 -
 119
119 -
 120
120 -
 121
121 -
 122
122 -
 123
123 -
 124
124 -
 125
125 -
126
-
127
-
128
-
129
-
130
-
131
-
132
-
133
-
134
-
135
-
136
-
137
-
138
-
139
-
140
-
141
-
142
-
143
-
144
-
145
-
146
-
147
-
148
-
149
-
150
-
151
-
152
-
153
-
154
-
155
-
156
-
157
-
158
-
159
-
160
-
161
-
162
-
163
-
164
-
165
-
166
-
167
-
168
-
169
-
170
-
171
-
172
-
173
-
174
-
175
-
176
-
177
-
178
-
179
-
180
-
181
-
182
-
183
-
184
-
185
-
186
-
187
-
188
-
189
-
190
-
191
-
192
-
193
-
194
-
195
-
196
-
197
-
198
-
199
-
200
-
201
-
202
-
203
-
204
-
205
-
206
-
207
-
208
-
209
-
210
-
211
-
212
-
213
-
214
-
215
-
216
-
217
-
218
-
219
-
220
-
221
-
222
-
223
-
224
-
225
-
226
-
227
-
228
-
229
-
230
-
231
-
232
-
233
-
234
-
235
-
236
-
237
-
238
-
239
-
240
-
241
-
242
-
243
-
244
-
245
-
246
-
247
-
248
-
249
-
250
-
251
-
252
-
253
-
254
-
255
-
256
-
257
-
258
-
259
-
260
-
261
-
262
-
263
-
264
-
265
-
266
-
267
-
268
-
269
-
270
-
271
-
272
-
273
-
274
-
275
-
276
-
277
-
278
-
279
-
280
-
281
-
282
-
283
-
284
-
285
-
286
-
287
-
288
-
289
-
290
-
291
-
292
-
293
-
294
-
295
-
296
-
297
-
298
-
299
-
300
-
301
-
302
-
303
-
304
-
305
-
306
-
307
-
308
-
309
-
310
-
311
-
312
-
313
-
314
-
315
-
316
-
317
-
318
-
319
-
320
-
321
-
322
-
323
-
324
-
325
-
326
-
327
-
328
-
329
-
330
-
331
-
332
-
333
-
334
-
335
-
336
 |
 |

SUSTAINABLE DEVELOPMENT
INDICATORS
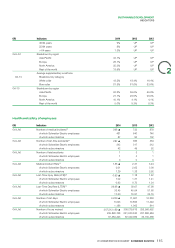
GRI Indicators 2014 2013 2012
Germany 3% 3% 3%
Australia 2% 2% 3%
Indonesia 3% 3% 3%
United Kingdom 3% 2% 2%
Russia 7% 8% 2%
Annual change in workforce by country
G4-10 (the most significant countries)(2)
2
France -2% -1% -4%
United States of America +8% +2% 0%
China +61% +1% -5%
India +12% +3% +6%
Mexico -7% +13% +3%
Spain -15% -9% -2%
Germany +7% -3% +2%
Brazil -8% +7% +21%
Australia 0% -3% -7%
Indonesia -4% +9% +33%
United Kingdom +29% -5% +6%
Russia 0% +269% +3%
G4-10 Breakdown of workforce by gender(2)
Men 70% ▲70% 69%
Women 30% ▲30% 31%
G4-10 Breakdown of workforce by gender and by category(2)
White collar 54% 53.7% 53.2%
Men 70% 71% 72%
Women 30% 29% 28%
Blue collar 46% 46.3% 46.8%
Men 70% 69% 65%
Women 30% 31% 35%
G4-10 Breakdown of workforce by age(2)
14/24 years 8.0% 8.4% 9.2%
25/34 years 31.9% 32.5% 33.2%
35/44 years 27.8% 27.8% 26.8%
45/54 years 20.8% 20.9% 20.7%
55/64 years 10.7% 9.9% 9.5%
>64 years 0.8% 0.5% 0.6%
G4-10 Breakdown of workforce by seniority(2)
<5 years 44.2% 42.6% 42.9%
5/14 years 33.6% 34.9% 33.5%
15/24 years 12.2% 12.6% 13.2%
25/34 years 7.2% 7.1% 7.2%
>34 years 2.8% 2.8% 3.2%
G4-10 Breakdown of workforce by function(2)
Marketing 3.6% 3.7% 3.8%
Sales 10.4% 10.6% 11.4%
Services and projects(6) 17.9% 16.0% 16.4%
Support 18.4% 19.5% 19.6%
Technical 6.9% 7.6% 7.6%
Industrial 6% 6% 6%
Direct variable costs
G4-10 49.1% 47.4% 46.7%(cost of employees under production or business costs)(7)
113
2014 REGISTRATION DOCUMENT SCHNEIDER ELECTRIC