APC 2014 Annual Report Download - page 232
Download and view the complete annual report
Please find page 232 of the 2014 APC annual report below. You can navigate through the pages in the report by either clicking on the pages listed below, or by using the keyword search tool below to find specific information within the annual report.-
 1
1 -
2
-
3
-
4
-
5
-
6
-
7
-
8
-
9
-
10
-
11
-
12
-
13
-
14
-
15
-
16
-
17
-
18
-
19
-
20
-
21
-
22
-
23
-
24
-
25
-
26
-
27
-
28
-
29
-
30
-
31
-
32
-
33
-
34
-
35
-
36
-
37
-
38
-
39
-
40
-
41
-
42
-
43
-
44
-
45
-
46
-
47
-
48
-
49
-
50
-
51
-
52
-
53
-
54
-
55
-
56
-
57
-
58
-
59
-
60
-
61
-
62
-
63
-
64
-
65
-
66
-
67
-
68
-
69
-
70
-
71
-
72
-
73
-
74
-
75
-
76
-
77
-
78
-
79
-
80
-
81
-
82
-
83
-
84
-
85
-
86
-
87
-
88
-
89
-
90
-
91
-
92
-
93
-
94
-
95
-
96
-
97
-
98
-
99
-
100
-
101
-
102
-
103
-
104
-
105
-
106
-
107
-
108
-
109
-
110
-
111
-
112
-
113
-
114
-
115
-
116
-
117
-
118
-
119
-
120
-
121
-
122
-
123
-
124
-
125
-
126
-
127
-
128
-
129
-
130
-
131
-
132
-
133
-
134
-
135
-
136
-
137
-
138
-
139
-
140
-
141
-
142
-
143
-
144
-
145
-
146
-
147
-
148
-
149
-
150
-
151
-
152
-
153
-
154
-
155
-
156
-
157
-
158
-
159
-
160
-
161
-
162
-
163
-
164
-
165
-
166
-
167
-
168
-
169
-
170
-
171
-
172
-
173
-
174
-
175
-
176
-
177
-
178
-
179
-
180
-
181
-
182
-
183
-
184
-
185
-
186
-
187
-
188
-
189
-
190
-
191
-
192
-
193
-
194
-
195
-
196
-
197
-
198
-
199
-
200
-
201
-
202
-
203
-
204
-
205
-
206
-
207
-
208
-
209
-
210
-
211
-
212
-
213
-
214
-
215
-
216
-
217
-
218
-
219
-
220
-
221
-
 222
222 -
 223
223 -
 224
224 -
 225
225 -
 226
226 -
 227
227 -
 228
228 -
 229
229 -
 230
230 -
 231
231 -
 232
232 -
 233
233 -
 234
234 -
 235
235 -
 236
236 -
 237
237 -
 238
238 -
 239
239 -
 240
240 -
 241
241 -
 242
242 -
243
-
244
-
245
-
246
-
247
-
248
-
249
-
250
-
251
-
252
-
253
-
254
-
255
-
256
-
257
-
258
-
259
-
260
-
261
-
262
-
263
-
264
-
265
-
266
-
267
-
268
-
269
-
270
-
271
-
272
-
273
-
274
-
275
-
276
-
277
-
278
-
279
-
280
-
281
-
282
-
283
-
284
-
285
-
286
-
287
-
288
-
289
-
290
-
291
-
292
-
293
-
294
-
295
-
296
-
297
-
298
-
299
-
300
-
301
-
302
-
303
-
304
-
305
-
306
-
307
-
308
-
309
-
310
-
311
-
312
-
313
-
314
-
315
-
316
-
317
-
318
-
319
-
320
-
321
-
322
-
323
-
324
-
325
-
326
-
327
-
328
-
329
-
330
-
331
-
332
-
333
-
334
-
335
-
336
 |
 |

5CONSOLIDATED FINANCIAL STATEMENTS AT DECEMBER31,2014
NOTES TO THE CONSOLIDATED FINANCIAL STATEMENTS
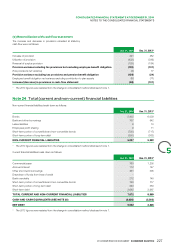
Financial instruments
Note26
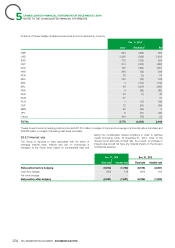
The Group uses financial instruments to manage its exposure to fluctuations in interest rates, exchange rates and metal prices.
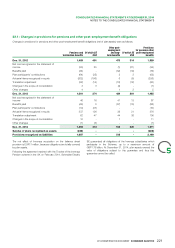
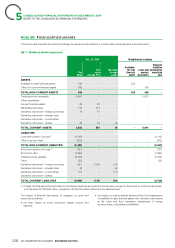
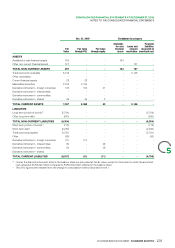
26.1 – Balance sheet exposure
Dec. 31, 2014 Breakdown by category
Financial
Available- liabilities
Fair Fair value Loans andfor-sale measured at
Fair value through financial account amortized
Value through P&L equity assets receivables cost
ASSETS
Available-for-sale financial assets 333 - - 333 - -
Other non-current financial assets 365 - - - 365 -
TOTAL NON-CURRENT ASSETS 698 - - 333 365 -
Trade accounts receivable 5,991 - - - 5,991 -
Other receivables
Current financial assets 49 49 - - - -
Marketable securities 714 714 - - - -
Derivative instrument – foreign currencies 70 70 - - - -
Derivative instrument – interest rates - - - - - -
Derivative instrument – commodities - - - - - -
Derivative instrument – shares 28 32 (4) - - -
TOTAL CURRENT ASSETS 6,852 865 (4) - 5,991 -
LIABILITIES
Long-term portion of bonds(1) (5,118) - - - - (5,118)
Other long-term debt (372) - - - - (372)
TOTAL NON-CURRENT LIABILITIES (5,490) - - - - (5,490)
Short-term portion of bonds(1) (751) - - - - (751)
Short-term debt (1,895) - - - - (1,895)
Trade accounts payable (4,106) - - - - (4,106)
Other (32) - - - - (32)
Derivative instrument – foreign currencies (151) (124) (27) - - -
Derivative instrument – interest rates (2) - (2) - - -
Derivative instrument – commodities (11) - (11) - - -
Derivative instrument – shares - - - - - -
TOTAL CURRENT LIABILITIES (6,948) (124) (40) (6,784)
Overall, the financial instruments listed in the balance sheet are accounted at the fair value, except for the bonds for which the amortized (1)
cost represents EUR5,869million compared to EUR5,405million reflected in the balance sheet.
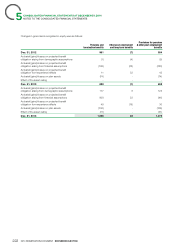
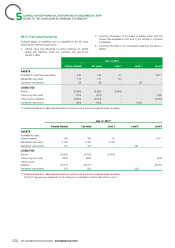
The impact of financial instruments, by category, on profit and the impact on equity primarily stemmed from the measurement
l
equity was as follows: of available-for-sale financial assets and derivative instruments
at fair value and from translation adjustments of foreign
the main impact on profit concerned interest income and
l
currency loans, receivables and liabilities.
expense;
230 2014 REGISTRATION DOCUMENT SCHNEIDER ELECTRIC