APC 2014 Annual Report Download - page 25
Download and view the complete annual report
Please find page 25 of the 2014 APC annual report below. You can navigate through the pages in the report by either clicking on the pages listed below, or by using the keyword search tool below to find specific information within the annual report.-
 1
1 -
2
-
3
-
4
-
5
-
6
-
7
-
8
-
9
-
10
-
11
-
12
-
13
-
14
-
 15
15 -
 16
16 -
 17
17 -
 18
18 -
 19
19 -
 20
20 -
 21
21 -
 22
22 -
 23
23 -
 24
24 -
 25
25 -
 26
26 -
 27
27 -
 28
28 -
 29
29 -
 30
30 -
 31
31 -
 32
32 -
 33
33 -
 34
34 -
 35
35 -
36
-
37
-
38
-
39
-
40
-
41
-
42
-
43
-
44
-
45
-
46
-
47
-
48
-
49
-
50
-
51
-
52
-
53
-
54
-
55
-
56
-
57
-
58
-
59
-
60
-
61
-
62
-
63
-
64
-
65
-
66
-
67
-
68
-
69
-
70
-
71
-
72
-
73
-
74
-
75
-
76
-
77
-
78
-
79
-
80
-
81
-
82
-
83
-
84
-
85
-
86
-
87
-
88
-
89
-
90
-
91
-
92
-
93
-
94
-
95
-
96
-
97
-
98
-
99
-
100
-
101
-
102
-
103
-
104
-
105
-
106
-
107
-
108
-
109
-
110
-
111
-
112
-
113
-
114
-
115
-
116
-
117
-
118
-
119
-
120
-
121
-
122
-
123
-
124
-
125
-
126
-
127
-
128
-
129
-
130
-
131
-
132
-
133
-
134
-
135
-
136
-
137
-
138
-
139
-
140
-
141
-
142
-
143
-
144
-
145
-
146
-
147
-
148
-
149
-
150
-
151
-
152
-
153
-
154
-
155
-
156
-
157
-
158
-
159
-
160
-
161
-
162
-
163
-
164
-
165
-
166
-
167
-
168
-
169
-
170
-
171
-
172
-
173
-
174
-
175
-
176
-
177
-
178
-
179
-
180
-
181
-
182
-
183
-
184
-
185
-
186
-
187
-
188
-
189
-
190
-
191
-
192
-
193
-
194
-
195
-
196
-
197
-
198
-
199
-
200
-
201
-
202
-
203
-
204
-
205
-
206
-
207
-
208
-
209
-
210
-
211
-
212
-
213
-
214
-
215
-
216
-
217
-
218
-
219
-
220
-
221
-
222
-
223
-
224
-
225
-
226
-
227
-
228
-
229
-
230
-
231
-
232
-
233
-
234
-
235
-
236
-
237
-
238
-
239
-
240
-
241
-
242
-
243
-
244
-
245
-
246
-
247
-
248
-
249
-
250
-
251
-
252
-
253
-
254
-
255
-
256
-
257
-
258
-
259
-
260
-
261
-
262
-
263
-
264
-
265
-
266
-
267
-
268
-
269
-
270
-
271
-
272
-
273
-
274
-
275
-
276
-
277
-
278
-
279
-
280
-
281
-
282
-
283
-
284
-
285
-
286
-
287
-
288
-
289
-
290
-
291
-
292
-
293
-
294
-
295
-
296
-
297
-
298
-
299
-
300
-
301
-
302
-
303
-
304
-
305
-
306
-
307
-
308
-
309
-
310
-
311
-
312
-
313
-
314
-
315
-
316
-
317
-
318
-
319
-
320
-
321
-
322
-
323
-
324
-
325
-
326
-
327
-
328
-
329
-
330
-
331
-
332
-
333
-
334
-
335
-
336
 |
 |

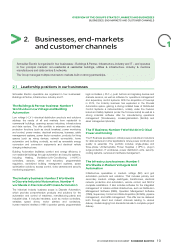
OVERVIEW OF THE GROUP’S STRATEGY, MARKETS AND BUSINESSES
AMBITIOUS LONG TERM FINANCIAL TARGETS FOR ATTRACTIVE SHAREHOLDER RETURNS
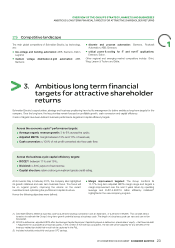
Competitive landscape
2.5
1
The main global competitors of Schneider Electric, by technology, discrete and process automation: Siemens, Rockwell
l
are: Automation; ABB; Emerson;
critical power&cooling for IT and non-IT applications:
l
low-voltage and building automation: ABB, Siemens, Eaton,
l
Emerson, Eaton.
Legrand;
Other regional and emerging market competitors include: Chint,
medium voltage distribution&grid automation: ABB,
l
Weg, Larsen&Toubro and Delta.
Siemens;
Ambitious long term financial
3.
targets forattractive shareholder
returns
Schneider Electric’s opportunities, strategy and business positioning have led its management to define ambitious long-term targets for the
company. Over the long term, the key priorities remain focused on profitable growth, cash conversion and capital efficiency.
2 sets of targets have been defined: business performance targets and capital efficiency targets.
Across the economic cycle(1) performance targets:
Average organic revenue growth: 3 to 6% across the cycle;
●
Adjusted EBITA: margin between 13% and 17% of revenues;
●
Cash conversion: c.100% of net profit converted into free cash flow.
●
Across the business cycle capital efficiency targets:
ROCE(2): between 11% and 15%;
●
Dividend: c.50% payout of net income;
●
Capital structure: retain a strong investment grade credit rating.
●
At its Investor Day in February 2015, the company also highlighted Margin improvement targeted: The Group confirms its
l
its growth initiatives and near term business focus. The focus will 13-17% long-term adjusted EBITA margin range and targets a
be on organic growth, improving the returns on the recent margin improvement over the next 3 years driven by operating
investments and optimizing the portfolio and capital structure. leverage and EUR1.4-EUR1.5 billion efficiency initiatives(3)
highlighted in the new company program.
Hence the following objectives were defined:
Schneider Electric defines a business cycle as a period including a slowdown and an expansion, or a period in between. This concept allows (1)
investors to estimate the Group’s long-term growth potential across a business cycle. The length of a business cycle can vary and can not be
forecasted.
ROCE is defined as: adjusted EBITA after tax/Average Capital Employed. Capital Employed is defined as: shareholders’ equity + Net financial debt (2)
+ Adjustment for associates and financial assets. In the context of the Invensys acquisition, the tax rate will be adjusted for any benefits of the
Invensys-related tax shield that would not be captured in the P&L.
Includes Industrial productivity and gross SFC savings.(3)
23
2014 REGISTRATION DOCUMENT SCHNEIDER ELECTRIC