APC 2014 Annual Report Download - page 111
Download and view the complete annual report
Please find page 111 of the 2014 APC annual report below. You can navigate through the pages in the report by either clicking on the pages listed below, or by using the keyword search tool below to find specific information within the annual report.-
 1
1 -
2
-
3
-
4
-
5
-
6
-
7
-
8
-
9
-
10
-
11
-
12
-
13
-
14
-
15
-
16
-
17
-
18
-
19
-
20
-
21
-
22
-
23
-
24
-
25
-
26
-
27
-
28
-
29
-
30
-
31
-
32
-
33
-
34
-
35
-
36
-
37
-
38
-
39
-
40
-
41
-
42
-
43
-
44
-
45
-
46
-
47
-
48
-
49
-
50
-
51
-
52
-
53
-
54
-
55
-
56
-
57
-
58
-
59
-
60
-
61
-
62
-
63
-
64
-
65
-
66
-
67
-
68
-
69
-
70
-
71
-
72
-
73
-
74
-
75
-
76
-
77
-
78
-
79
-
80
-
81
-
82
-
83
-
84
-
85
-
86
-
87
-
88
-
89
-
90
-
91
-
92
-
93
-
94
-
95
-
96
-
97
-
98
-
99
-
100
-
 101
101 -
 102
102 -
 103
103 -
 104
104 -
 105
105 -
 106
106 -
 107
107 -
 108
108 -
 109
109 -
 110
110 -
 111
111 -
 112
112 -
 113
113 -
 114
114 -
 115
115 -
 116
116 -
 117
117 -
 118
118 -
 119
119 -
 120
120 -
 121
121 -
122
-
123
-
124
-
125
-
126
-
127
-
128
-
129
-
130
-
131
-
132
-
133
-
134
-
135
-
136
-
137
-
138
-
139
-
140
-
141
-
142
-
143
-
144
-
145
-
146
-
147
-
148
-
149
-
150
-
151
-
152
-
153
-
154
-
155
-
156
-
157
-
158
-
159
-
160
-
161
-
162
-
163
-
164
-
165
-
166
-
167
-
168
-
169
-
170
-
171
-
172
-
173
-
174
-
175
-
176
-
177
-
178
-
179
-
180
-
181
-
182
-
183
-
184
-
185
-
186
-
187
-
188
-
189
-
190
-
191
-
192
-
193
-
194
-
195
-
196
-
197
-
198
-
199
-
200
-
201
-
202
-
203
-
204
-
205
-
206
-
207
-
208
-
209
-
210
-
211
-
212
-
213
-
214
-
215
-
216
-
217
-
218
-
219
-
220
-
221
-
222
-
223
-
224
-
225
-
226
-
227
-
228
-
229
-
230
-
231
-
232
-
233
-
234
-
235
-
236
-
237
-
238
-
239
-
240
-
241
-
242
-
243
-
244
-
245
-
246
-
247
-
248
-
249
-
250
-
251
-
252
-
253
-
254
-
255
-
256
-
257
-
258
-
259
-
260
-
261
-
262
-
263
-
264
-
265
-
266
-
267
-
268
-
269
-
270
-
271
-
272
-
273
-
274
-
275
-
276
-
277
-
278
-
279
-
280
-
281
-
282
-
283
-
284
-
285
-
286
-
287
-
288
-
289
-
290
-
291
-
292
-
293
-
294
-
295
-
296
-
297
-
298
-
299
-
300
-
301
-
302
-
303
-
304
-
305
-
306
-
307
-
308
-
309
-
310
-
311
-
312
-
313
-
314
-
315
-
316
-
317
-
318
-
319
-
320
-
321
-
322
-
323
-
324
-
325
-
326
-
327
-
328
-
329
-
330
-
331
-
332
-
333
-
334
-
335
-
336
 |
 |

SUSTAINABLE DEVELOPMENT
INDICATORS
Indicators
7.
Environmental indicators
7.1
2
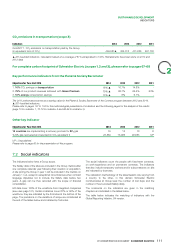
The indicators below have a Group scope. They illustrate our Schneider Electric provides readers two pieces of information so
industrial and logistics sites’ environmental consumption, emission that environmental performance can be compared from one year
and waste in addition to certain major tertiary sites. The scope of to the next:
environmental reporting is that of ISO14001 certified sites, and the publication of indicators on a constant scope;
l
certain non-certified sites on a voluntary basis and without the publication of indicators per employee to correct the
l
interruption in time. All of the industrial and logistics sites with more changes in activities of the sites. The sites’ workforce includes
than 50people and the major tertiary sites with more than Schneider Electric employees (fixed-term, permanent and
500people must be ISO14001 certified within two years after their work/study participants), temporary staff and on-site
acquisition or creation. A gap can, therefore, be recorded with the subcontractors.
scope of financial consolidation. The scope of environmental
Comments on the indicators are included in the corresponding
reporting covers about 60% of the Group headcount, against 70%
chapters.
in 2013. This decrease is mainly due to the acquisition of Invensys,
consolidated in the Group's workforce and not integrated in the
environmental reporting.
ISO14001 certification of the sites
2014 2013 2012
Number of ISO14001 Certified Sites 270▲279 280
Industrial and logistics sites 252 UP 258
Tertiary sites 18 UP 22
New sites certified this year 12 20 11
Certified sites that have closed or consolidated this year 21 20 4
▲ 2014 audited indicators.
UP = Unpublished.
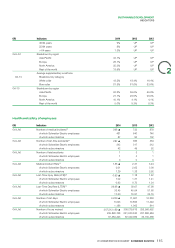
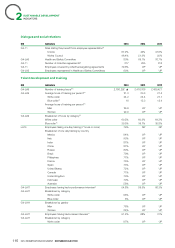
Group sites consumption, emissions and waste
Current Scope Constant Scope
GRI Indicators 2014 2013 2012 2014 2013
Number of participating sites 266▲281 283 260 260
Total employees 103,886▲108,126 98,923(1) 102,708 100,311
G4-EN23 Waste produced (in t) 132,171▲139,044 134,814 131,181 139,698
of which hazardous waste(2) 6% 4% UP UP UP
G4-EN23 Waste produced per employee (in t/p) 1.3▲1.3 1.4 1.3 1.4
G4-EN23 Waste recovered (in t) 115,166▲120,490 115,382 114,415 121,960
G4-EN23 Share of waste recovered 87.1% ▲86.7% 85.6% 87.2% 87.3%
of which metal waste recovered UP 99.4% UP UP UP
Target share of waste recovered - - - 87% -
G4-EN8 Water withdrawn for consumption (m3)2,055,999▲2,377,680 2,456,716 2,047,948 2,200,172
of which public water (m3) 1,678,518 1,928,151 1,973,348 UP UP
of which ground water (m3) 299,481 397,843 483,367 UP UP
of which surface water (m3) 20,300 20,667 - UP UP
of which other sources (m3) 57,700 31,019 - UP UP
G4-EN8 Water consumption/employee (m3/p) 19.8▲22.0 24.8 19.9 21.9
Change in water consumption per employee - - - -9.1% -
Target consumption of water per employee - - - -3.3% -
109
2014 REGISTRATION DOCUMENT SCHNEIDER ELECTRIC