APC 2014 Annual Report Download - page 41
Download and view the complete annual report
Please find page 41 of the 2014 APC annual report below. You can navigate through the pages in the report by either clicking on the pages listed below, or by using the keyword search tool below to find specific information within the annual report.-
 1
1 -
2
-
3
-
4
-
5
-
6
-
7
-
8
-
9
-
10
-
11
-
12
-
13
-
14
-
15
-
16
-
17
-
18
-
19
-
20
-
21
-
22
-
23
-
24
-
25
-
26
-
27
-
28
-
29
-
30
-
 31
31 -
 32
32 -
 33
33 -
 34
34 -
 35
35 -
 36
36 -
 37
37 -
 38
38 -
 39
39 -
 40
40 -
 41
41 -
 42
42 -
 43
43 -
 44
44 -
 45
45 -
 46
46 -
 47
47 -
 48
48 -
 49
49 -
 50
50 -
 51
51 -
52
-
53
-
54
-
55
-
56
-
57
-
58
-
59
-
60
-
61
-
62
-
63
-
64
-
65
-
66
-
67
-
68
-
69
-
70
-
71
-
72
-
73
-
74
-
75
-
76
-
77
-
78
-
79
-
80
-
81
-
82
-
83
-
84
-
85
-
86
-
87
-
88
-
89
-
90
-
91
-
92
-
93
-
94
-
95
-
96
-
97
-
98
-
99
-
100
-
101
-
102
-
103
-
104
-
105
-
106
-
107
-
108
-
109
-
110
-
111
-
112
-
113
-
114
-
115
-
116
-
117
-
118
-
119
-
120
-
121
-
122
-
123
-
124
-
125
-
126
-
127
-
128
-
129
-
130
-
131
-
132
-
133
-
134
-
135
-
136
-
137
-
138
-
139
-
140
-
141
-
142
-
143
-
144
-
145
-
146
-
147
-
148
-
149
-
150
-
151
-
152
-
153
-
154
-
155
-
156
-
157
-
158
-
159
-
160
-
161
-
162
-
163
-
164
-
165
-
166
-
167
-
168
-
169
-
170
-
171
-
172
-
173
-
174
-
175
-
176
-
177
-
178
-
179
-
180
-
181
-
182
-
183
-
184
-
185
-
186
-
187
-
188
-
189
-
190
-
191
-
192
-
193
-
194
-
195
-
196
-
197
-
198
-
199
-
200
-
201
-
202
-
203
-
204
-
205
-
206
-
207
-
208
-
209
-
210
-
211
-
212
-
213
-
214
-
215
-
216
-
217
-
218
-
219
-
220
-
221
-
222
-
223
-
224
-
225
-
226
-
227
-
228
-
229
-
230
-
231
-
232
-
233
-
234
-
235
-
236
-
237
-
238
-
239
-
240
-
241
-
242
-
243
-
244
-
245
-
246
-
247
-
248
-
249
-
250
-
251
-
252
-
253
-
254
-
255
-
256
-
257
-
258
-
259
-
260
-
261
-
262
-
263
-
264
-
265
-
266
-
267
-
268
-
269
-
270
-
271
-
272
-
273
-
274
-
275
-
276
-
277
-
278
-
279
-
280
-
281
-
282
-
283
-
284
-
285
-
286
-
287
-
288
-
289
-
290
-
291
-
292
-
293
-
294
-
295
-
296
-
297
-
298
-
299
-
300
-
301
-
302
-
303
-
304
-
305
-
306
-
307
-
308
-
309
-
310
-
311
-
312
-
313
-
314
-
315
-
316
-
317
-
318
-
319
-
320
-
321
-
322
-
323
-
324
-
325
-
326
-
327
-
328
-
329
-
330
-
331
-
332
-
333
-
334
-
335
-
336
 |
 |

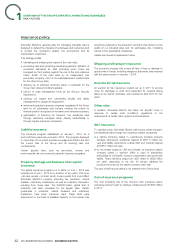
OVERVIEW OF THE GROUP’S STRATEGY, MARKETS AND BUSINESSES
RISK FACTORS
Market risks
1
Interest rate risk
Equity risk
The Group is exposed to risks associated with the effect of
changing interest rates in different countries. Interest rate risk on Exposure to equity risk primarily relates to treasury shares but
borrowings is managed at the Group level, based on consolidated remains limited. The Group does not use any financial instruments
debt and taking into consideration market conditions in order to to hedge thesepositions.
optimize overall borrowing costs. Most bond debt is fixed rate. At
An increase in raw material prices could have
December31, 2014, 79% of the Group’s gross debt was fixed
rate.
negative consequences
Maturities of financial liabilities are presented in note24.1 to the
consolidated financial statements. The Group is exposed to fluctuations in energy and raw material
A 1% increase in interest rates would have a positive impact of prices, in particular steel, copper, aluminum, silver, lead, nickel,
around EUR10million on the Group’s net financial expense. zinc and plastics. If we are not able to hedge, compensate for or
pass on to customers any such increased costs, this could have
The financial instruments used to hedge the exposure of the Group an adverse impact on our financial results.
to fluctuations in interest rates are described in note26 to the
consolidated financial statements for the year ended December31, The Group has, however, implemented certain procedures to limit
2014. exposure to rising non-ferrous and precious raw material prices.
The purchasing departments of the operating units report their
The Group’s international operations expose it
purchasing forecasts to the Corporate Finance and Treasury
to currency exchange risk
Department. Purchase commitments are hedged using forward
contracts, swaps and, to a lesser extent, options.
Due to the fact that a significant proportion of transactions of
Schneider Electric are denominated in currencies other than the The financial instruments used to hedge our exposure to
euro, the Group is exposed to currency risk. If the Group is not fluctuations in raw material prices are described in note26 to the
able to hedge these risks, fluctuations in exchange rates between consolidated financial statements for the year ended December31,
the euro and these currencies can have a significant impact on our 2014.
results and distort year-on-year performance comparisons. In2014, purchases of raw materials totaled around EUR2billion,
We manage our exposure to currency risk to reduce the sensitivity including around EUR900million for non-ferrous and precious
of earnings to changes in exchange rates through hedging metals, of which roughly 57% was for copper. The Group enters
programs relating to receivables, payables and cash flows, which into swap and options agreements intended to hedge all or part of
are primarily hedged by means of forward purchases and sales. its non-ferrous and precious metals purchases in order to limit the
impact of price volatility of these raw materials on our results. At
Depending on market conditions, risks in the main currencies may December31, 2014, the Group had hedged positions with a
be hedged based on cash flow forecasting using contracts that nominal value ofEUR271million on these transactions.
expire in 12months or less.
Counterparty risk
Schneider Electric’s currency hedging policy is to protect our
subsidiaries against risks on transactions denominated in a
currency other than their functional currency. More than twenty Financial transactions are entered into with carefully selected
currencies are involved, with the US dollar, Chinese Yuan, counterparties. Banking counterparties are chosen according to
Singapore Dollar, Australian Dollar, British Pound, the Hungarian the customary criteria, including the credit rating issued by an
Forint and Russian Rubbles representing the most significant independent rating agency.
sources of those risks. The financial instruments used to hedge our
exposure to fluctuations in exchange rates are described in Group policy consists of diversifying counterparty risks and
note26 to the consolidated financial statements for the year ended periodic controls are performed to check compliance with the
December31, 2014 (Chapter5). related rules.
In2014, revenue in foreign currencies amounted to In addition, the Group takes out substantial credit insurance and
EUR19.7billion, including around EUR7billion in US dollar and uses other types of guarantees to limit the risk of losses on trade
3.4billion in Chinese yuan. accounts receivable.
The main exposure of the Group in terms of currency exchange
Liquidity risk
risk is related to the US dollar, the Chinese yuan and to currencies
linked to the US dollar. The Group estimates that in the current
structure of its operations, a 5% increase of the euro compared to Liquidity is provided by the Group’s cash and cash equivalents and
the US dollar would have a negligible impact on operating margin undrawn confirmed lines of credit. As of December31, 2014, the
(a translation effect of EUR44million on EBITA). Group had access to cash and cash equivalents totaling
EUR2.4billion. As of December31, 2014, the Group had EUR
2.4billion in undrawn confirmed lines of credit, of which
EUR2.4billion matures after December2015.
The Group’s credit rating enables it to raise significant long-term
financing and attract a diverse investor base. The Group currently
has an A- (negative outlook) credit rating from Standard&Poor’s
39
2014 REGISTRATION DOCUMENT SCHNEIDER ELECTRIC