APC 2014 Annual Report Download - page 114
Download and view the complete annual report
Please find page 114 of the 2014 APC annual report below. You can navigate through the pages in the report by either clicking on the pages listed below, or by using the keyword search tool below to find specific information within the annual report.-
 1
1 -
2
-
3
-
4
-
5
-
6
-
7
-
8
-
9
-
10
-
11
-
12
-
13
-
14
-
15
-
16
-
17
-
18
-
19
-
20
-
21
-
22
-
23
-
24
-
25
-
26
-
27
-
28
-
29
-
30
-
31
-
32
-
33
-
34
-
35
-
36
-
37
-
38
-
39
-
40
-
41
-
42
-
43
-
44
-
45
-
46
-
47
-
48
-
49
-
50
-
51
-
52
-
53
-
54
-
55
-
56
-
57
-
58
-
59
-
60
-
61
-
62
-
63
-
64
-
65
-
66
-
67
-
68
-
69
-
70
-
71
-
72
-
73
-
74
-
75
-
76
-
77
-
78
-
79
-
80
-
81
-
82
-
83
-
84
-
85
-
86
-
87
-
88
-
89
-
90
-
91
-
92
-
93
-
94
-
95
-
96
-
97
-
98
-
99
-
100
-
101
-
102
-
103
-
 104
104 -
 105
105 -
 106
106 -
 107
107 -
 108
108 -
 109
109 -
 110
110 -
 111
111 -
 112
112 -
 113
113 -
 114
114 -
 115
115 -
 116
116 -
 117
117 -
 118
118 -
 119
119 -
 120
120 -
 121
121 -
 122
122 -
 123
123 -
 124
124 -
125
-
126
-
127
-
128
-
129
-
130
-
131
-
132
-
133
-
134
-
135
-
136
-
137
-
138
-
139
-
140
-
141
-
142
-
143
-
144
-
145
-
146
-
147
-
148
-
149
-
150
-
151
-
152
-
153
-
154
-
155
-
156
-
157
-
158
-
159
-
160
-
161
-
162
-
163
-
164
-
165
-
166
-
167
-
168
-
169
-
170
-
171
-
172
-
173
-
174
-
175
-
176
-
177
-
178
-
179
-
180
-
181
-
182
-
183
-
184
-
185
-
186
-
187
-
188
-
189
-
190
-
191
-
192
-
193
-
194
-
195
-
196
-
197
-
198
-
199
-
200
-
201
-
202
-
203
-
204
-
205
-
206
-
207
-
208
-
209
-
210
-
211
-
212
-
213
-
214
-
215
-
216
-
217
-
218
-
219
-
220
-
221
-
222
-
223
-
224
-
225
-
226
-
227
-
228
-
229
-
230
-
231
-
232
-
233
-
234
-
235
-
236
-
237
-
238
-
239
-
240
-
241
-
242
-
243
-
244
-
245
-
246
-
247
-
248
-
249
-
250
-
251
-
252
-
253
-
254
-
255
-
256
-
257
-
258
-
259
-
260
-
261
-
262
-
263
-
264
-
265
-
266
-
267
-
268
-
269
-
270
-
271
-
272
-
273
-
274
-
275
-
276
-
277
-
278
-
279
-
280
-
281
-
282
-
283
-
284
-
285
-
286
-
287
-
288
-
289
-
290
-
291
-
292
-
293
-
294
-
295
-
296
-
297
-
298
-
299
-
300
-
301
-
302
-
303
-
304
-
305
-
306
-
307
-
308
-
309
-
310
-
311
-
312
-
313
-
314
-
315
-
316
-
317
-
318
-
319
-
320
-
321
-
322
-
323
-
324
-
325
-
326
-
327
-
328
-
329
-
330
-
331
-
332
-
333
-
334
-
335
-
336
 |
 |

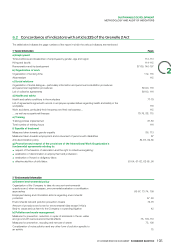
2SUSTAINABLE DEVELOPMENT
INDICATORS
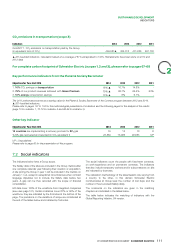
Key performance indicators from the Planet&Society Barometer
Objectives for Year-End-2014 2014 2013 2012 2011
1. 30% reduction in the Medical Incident Rate (MIR) -61% ▲-47% -23% -
2. 63%* result in our Employee Engagement Index 61% ▲60% 55% -
3. 30% women in our talent pool (~2,500people) 28% ▲28% 27% 23%
4. 1 day of training for each employee every year 79% ▲67% -** -
5. 300 sites recognized as «Cool sites»355 ▲224 -** -
The 2011 performance serves as a starting value for the Planet&Society Barometer of the Connect program between 2012 and 2014.
▲ 2014 audited indicators.
* A new target has been set from 2014 for this indicator: 63% instead of 70% at end-2014. With 63%, the Group gives itself the challenge to
be 7points above its industry average (source: Aon Hewitt).
** These indicators are reported from 2013. The reporting tools have been deployed during 2012.
Please refer to pages101 to 104for the methodological presentation of indicators and the following pages for the analysis of the results
(pages77-79 for indicator1, 79-81 for indicator2, 84-86 for indicator3, 81-83 for indicator4 and 80 for indicator5).
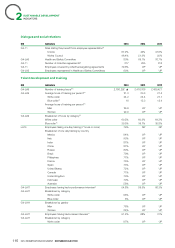
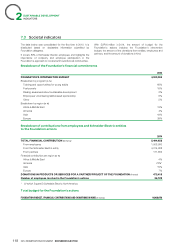
Workforce
GRI Indicators 2014 2013 2012
Workforce
G4-10 Average workforce(1) 185,965 ▲163,033 152,384
Blue collar (VDC) 95,213 81,712 75,601
White collar (non-VDC) 90,752 81,322 76,383
G4-10 Average supplementary workforce 16,875 ▲14,849 13,947
G4-10 Fixed-term contract and permanent contract personnel(2) 167,124 ▲152,784 139,989
Permanent contract 91.8% 90.5% 90.2%
Fixed-term contract 8.2% 9.5% 9.8%
Share of temporary personnel
G4-10 16.8% 17.7% 17.4%(fixed-term contracts andtemporaryworkers)(2)
G4-10 Organization of working time(3)
Full-time 94% 98% 98%
Part-time 6% 2% 2%
G4-LA1 Hires(4) 28,830 ▲23,079 20,971
G4-LA1 Departures(4) 29,460 ▲21,600 20,615
Layoffs 6,454 ▲5,071 5,719
Resignations 15,826 ▲10,909 10,379
Others (retirement, end of contract,etc.) 7,180 5,743 4,489
G4-LA1 Voluntary turnover 9.4% ▲7.4% 7.5%
G4-10 Breakdown of workforce by region(2)
Asia-Pacific 34% 30% 31%
Europe 37% 40% 38%
North America 19% 20% 21%
Rest of the world 10% 10% 10%
Breakdown of workforce by country
G4-10 (the most significant countries)(2)
France 11% 12% 14%
United States of America 12% 13% 13%
China 15% 10% 11%
India 9% 9% 9%
Mexico 5% 6% 5%
Spain 3% 4% 4%
Brazil 3% 4% 4%
112 2014 REGISTRATION DOCUMENT SCHNEIDER ELECTRIC