APC 2014 Annual Report Download - page 195
Download and view the complete annual report
Please find page 195 of the 2014 APC annual report below. You can navigate through the pages in the report by either clicking on the pages listed below, or by using the keyword search tool below to find specific information within the annual report.-
 1
1 -
2
-
3
-
4
-
5
-
6
-
7
-
8
-
9
-
10
-
11
-
12
-
13
-
14
-
15
-
16
-
17
-
18
-
19
-
20
-
21
-
22
-
23
-
24
-
25
-
26
-
27
-
28
-
29
-
30
-
31
-
32
-
33
-
34
-
35
-
36
-
37
-
38
-
39
-
40
-
41
-
42
-
43
-
44
-
45
-
46
-
47
-
48
-
49
-
50
-
51
-
52
-
53
-
54
-
55
-
56
-
57
-
58
-
59
-
60
-
61
-
62
-
63
-
64
-
65
-
66
-
67
-
68
-
69
-
70
-
71
-
72
-
73
-
74
-
75
-
76
-
77
-
78
-
79
-
80
-
81
-
82
-
83
-
84
-
85
-
86
-
87
-
88
-
89
-
90
-
91
-
92
-
93
-
94
-
95
-
96
-
97
-
98
-
99
-
100
-
101
-
102
-
103
-
104
-
105
-
106
-
107
-
108
-
109
-
110
-
111
-
112
-
113
-
114
-
115
-
116
-
117
-
118
-
119
-
120
-
121
-
122
-
123
-
124
-
125
-
126
-
127
-
128
-
129
-
130
-
131
-
132
-
133
-
134
-
135
-
136
-
137
-
138
-
139
-
140
-
141
-
142
-
143
-
144
-
145
-
146
-
147
-
148
-
149
-
150
-
151
-
152
-
153
-
154
-
155
-
156
-
157
-
158
-
159
-
160
-
161
-
162
-
163
-
164
-
165
-
166
-
167
-
168
-
169
-
170
-
171
-
172
-
173
-
174
-
175
-
176
-
177
-
178
-
179
-
180
-
181
-
182
-
183
-
184
-
 185
185 -
 186
186 -
 187
187 -
 188
188 -
 189
189 -
 190
190 -
 191
191 -
 192
192 -
 193
193 -
 194
194 -
 195
195 -
 196
196 -
 197
197 -
 198
198 -
 199
199 -
 200
200 -
 201
201 -
 202
202 -
 203
203 -
 204
204 -
 205
205 -
206
-
207
-
208
-
209
-
210
-
211
-
212
-
213
-
214
-
215
-
216
-
217
-
218
-
219
-
220
-
221
-
222
-
223
-
224
-
225
-
226
-
227
-
228
-
229
-
230
-
231
-
232
-
233
-
234
-
235
-
236
-
237
-
238
-
239
-
240
-
241
-
242
-
243
-
244
-
245
-
246
-
247
-
248
-
249
-
250
-
251
-
252
-
253
-
254
-
255
-
256
-
257
-
258
-
259
-
260
-
261
-
262
-
263
-
264
-
265
-
266
-
267
-
268
-
269
-
270
-
271
-
272
-
273
-
274
-
275
-
276
-
277
-
278
-
279
-
280
-
281
-
282
-
283
-
284
-
285
-
286
-
287
-
288
-
289
-
290
-
291
-
292
-
293
-
294
-
295
-
296
-
297
-
298
-
299
-
300
-
301
-
302
-
303
-
304
-
305
-
306
-
307
-
308
-
309
-
310
-
311
-
312
-
313
-
314
-
315
-
316
-
317
-
318
-
319
-
320
-
321
-
322
-
323
-
324
-
325
-
326
-
327
-
328
-
329
-
330
-
331
-
332
-
333
-
334
-
335
-
336
 |
 |

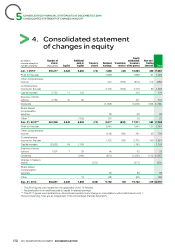
CONSOLIDATED FINANCIAL STATEMENTS AT DECEMBER31,2014
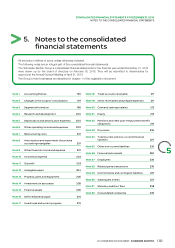
NOTES TO THE CONSOLIDATED FINANCIAL STATEMENTS
1.11–Impairment of assets
monitor operations and assess synergies deriving from
acquisitions.
In accordance with IAS36 – Impairment of Assets – the Group Where the recoverable amount of an asset or CGU is lower than its
assesses the recoverable amount of its long-lived assets as book value, an impairment loss is recognized for the excess of the
follows: book value over the recoverable value. The recoverable value is
for all property, plant and equipment subject to depreciation and
l
defined as the highest value between the value in use and the
intangible assets subject to amortization, the Group carries out a realizable value net of costs. Where the tested CGU comprises
review at each balance sheet date to assess whether there is goodwill, any impairment losses are firstly deducted there from.
any indication that they may be impaired. Indications of
1.12– Non-current financial assets
impairment are identified on the basis of external or internal
information. If such an indication exists, the Group tests the
asset for impairment by comparing its carrying amount to the Investments in non-consolidated companies are classified as
higher of fair value minus costs to sell and value in use; available-for-sale financial assets. They are initially recorded at their
non-amortizable intangible assets and goodwill are tested for
l
cost of acquisition and subsequently measured at fair value, when
impairment at least annually and whenever there is an indication fair value can be reliably determined.
that the asset may be impaired. The fair value of investments listed in an active market may be
Value in use is determined by discounting future cash flows that determined reliably and corresponds to the listed price at balance
will be generated by the tested assets. These future cash flows are sheet date (Level 1 from the fair value hierarchy as per IFRS7).
based on Group management’s economic assumptions and
In cases where fair value cannot be reliably determined on
operating forecasts presented in forecasts over a period generally
observable markets, the investments are measured at cost net of
not exceeding 5 years, and then extrapolated based on a
any accumulated impairment losses. The recoverable amount is
perpetuity growth rate. The discount rate corresponds to the
determined by assessing either the Group’ share in the entity’s net
Group’s weighted average cost of capital (WACC) at the
assets or the expected future cash-flows representative of
measurement date plus a risk premium depending on the region in
management expectation in this investment. This rule is applied in
question. The WACC stood at 7.6% at December31, 2014, a
particular to unlisted shares.
slight decrease on the 7.8% at December31, 2013. This rate is
based on (i) a long-term interest rate of 2.6%, corresponding to the Changes in fair value are accumulated as other comprehensive
average interest rate for 10years OAT treasury bonds over the income in the comprehensive income statement and, in balance
past few years, (ii) the average premium applied to financing sheet, in equity under«Other reserves»up to the date of sale, at
obtained by the Group over the last period, and (iii) the weighted which time they are recognized in the income statement.
country risk premium for the Group’s businesses in the countries in Unrealized losses on assets that are considered to be permanently
question. impaired are recorded at the statement of income under financial
loss.
The perpetuity growth rate was 2%, unchanged on the previous
financial year. Loans, recorded under«Other non-current financial assets», are
carried at amortized cost and tested for impairment where there is
Impairment tests are performed at the level of the cash-generating
an indication that they may have been impaired. Non-current
unit (CGU) to which the asset belongs. A cash-generating unit is
5
financial receivables are discounted when the impact of
the smallest group of assets that generates cash inflows that are
discounting is considered significant.
largely independent of the cash flows from other assets or groups
of assets. The cash-generating units in2013 were Partner,
1.13– Inventories and work in process
Infrastructure, Industry, IT, Buildings and CST CGUs. In 2014,
Schneider Electric decided to regroup its Buildings and Partner
businesses into a single business to provide its customers a Inventories and work in progress are measured at the lower of their
complete offer to address the buildings market; this led to the initial recognition cost (acquisition cost or production cost generally
merge of Partner and Buildings CGUs. Additionally CST was sold determined by the weighted average price method) or of their
on October1, 2014. Hence, the cash-generating units in2014 are estimated net realizable value.
Buildings & Partner, Infrastructure, Industry and IT CGUs Net Net realizable value corresponds to the estimated selling price net
assets were reallocated to the CGUs at the lowest possible level of remaining expenses to complete and/or sell the products.
on the basis of the CGU activities to which they belong; the assets
belonging to several activities were allocated to each CGU Inventory impairment losses are recognized in«Cost of sales».
(Buildings & Partner, Infrastructure and Industry mainly) pro-rata to The cost of work in progress, semi-finished and finished products,
their revenue in that CGU. includes the cost of materials and direct labor, subcontracting
The WACC used to determine the value in use of each CGU was costs, all production overheads based on normal manufacturing
8.3% for Buildings & Partner, 8.4% for Industry, 8.4% for IT, or and capacity and the portion of research and development costs that
8.6% for Infrastructure.are directly related to the manufacturing process (corresponding to
the amortization of capitalized projects in production and product
Goodwill is allocated when initially recognized. The CGU allocation and range of products maintenance costs).
is done on the same basis as used by Group management to
193
2014 REGISTRATION DOCUMENT SCHNEIDER ELECTRIC