APC 2014 Annual Report Download - page 76
Download and view the complete annual report
Please find page 76 of the 2014 APC annual report below. You can navigate through the pages in the report by either clicking on the pages listed below, or by using the keyword search tool below to find specific information within the annual report.-
 1
1 -
2
-
3
-
4
-
5
-
6
-
7
-
8
-
9
-
10
-
11
-
12
-
13
-
14
-
15
-
16
-
17
-
18
-
19
-
20
-
21
-
22
-
23
-
24
-
25
-
26
-
27
-
28
-
29
-
30
-
31
-
32
-
33
-
34
-
35
-
36
-
37
-
38
-
39
-
40
-
41
-
42
-
43
-
44
-
45
-
46
-
47
-
48
-
49
-
50
-
51
-
52
-
53
-
54
-
55
-
56
-
57
-
58
-
59
-
60
-
61
-
62
-
63
-
64
-
65
-
 66
66 -
 67
67 -
 68
68 -
 69
69 -
 70
70 -
 71
71 -
 72
72 -
 73
73 -
 74
74 -
 75
75 -
 76
76 -
 77
77 -
 78
78 -
 79
79 -
 80
80 -
 81
81 -
 82
82 -
 83
83 -
 84
84 -
 85
85 -
 86
86 -
87
-
88
-
89
-
90
-
91
-
92
-
93
-
94
-
95
-
96
-
97
-
98
-
99
-
100
-
101
-
102
-
103
-
104
-
105
-
106
-
107
-
108
-
109
-
110
-
111
-
112
-
113
-
114
-
115
-
116
-
117
-
118
-
119
-
120
-
121
-
122
-
123
-
124
-
125
-
126
-
127
-
128
-
129
-
130
-
131
-
132
-
133
-
134
-
135
-
136
-
137
-
138
-
139
-
140
-
141
-
142
-
143
-
144
-
145
-
146
-
147
-
148
-
149
-
150
-
151
-
152
-
153
-
154
-
155
-
156
-
157
-
158
-
159
-
160
-
161
-
162
-
163
-
164
-
165
-
166
-
167
-
168
-
169
-
170
-
171
-
172
-
173
-
174
-
175
-
176
-
177
-
178
-
179
-
180
-
181
-
182
-
183
-
184
-
185
-
186
-
187
-
188
-
189
-
190
-
191
-
192
-
193
-
194
-
195
-
196
-
197
-
198
-
199
-
200
-
201
-
202
-
203
-
204
-
205
-
206
-
207
-
208
-
209
-
210
-
211
-
212
-
213
-
214
-
215
-
216
-
217
-
218
-
219
-
220
-
221
-
222
-
223
-
224
-
225
-
226
-
227
-
228
-
229
-
230
-
231
-
232
-
233
-
234
-
235
-
236
-
237
-
238
-
239
-
240
-
241
-
242
-
243
-
244
-
245
-
246
-
247
-
248
-
249
-
250
-
251
-
252
-
253
-
254
-
255
-
256
-
257
-
258
-
259
-
260
-
261
-
262
-
263
-
264
-
265
-
266
-
267
-
268
-
269
-
270
-
271
-
272
-
273
-
274
-
275
-
276
-
277
-
278
-
279
-
280
-
281
-
282
-
283
-
284
-
285
-
286
-
287
-
288
-
289
-
290
-
291
-
292
-
293
-
294
-
295
-
296
-
297
-
298
-
299
-
300
-
301
-
302
-
303
-
304
-
305
-
306
-
307
-
308
-
309
-
310
-
311
-
312
-
313
-
314
-
315
-
316
-
317
-
318
-
319
-
320
-
321
-
322
-
323
-
324
-
325
-
326
-
327
-
328
-
329
-
330
-
331
-
332
-
333
-
334
-
335
-
336
 |
 |

2SUSTAINABLE DEVELOPMENT
SCHNEIDER ELECTRIC’S COMMITMENT TO ENVIRONMENTAL PERFORMANCE
At the Group level, the scope of certification covers about 60% of Finally, within the scope of Everblue, water consumption in 2014
employees. was reduced by 23% versus the 2011 baseline (data normalized
on for headcounts and activity evolution). The overall Group
The challenge for the future is to maintain this performance level by objective of 10% reduction in 3years has been exceeded.
certifying all new industrial sites within two years of their acquisition
or creation and to continue the new certifications of large tertiary Thanks to a new reporting system, the detailed water usage is
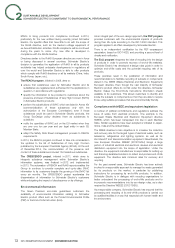
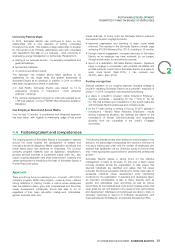
sites. reported. Here is the breakdown of the Group water use (within the
Everblue scope):
Management of industrial consumption
9%
Canteen
8%
HVAC
30%
Process
36%
Sanitary
12%
Gardening
5%
Other usage
Water consumption
The Group provides a detailed breakdown of water consumption
that takes into account water from the public network,
groundwater, surface water (lakes, rivers, etc.) and other sources
(rain, recycled water, etc.). Water drawn for the sole purpose of
cooling and immediately released without alteration also began to
be monitored and has been subject to separate reporting for some
sites since2012.
Water is not generally a critical resource in Schneider Electric’s
industrial processes. The topic was considered not very material by Notes: other usage includes exceptional water usage such as
both internal and external stakeholders during the materiality water used for construction of new buildings.
analysis.
HVAC =Heating, Ventilation, Air Conditioning.
As Schneider Electric industrial production is mainly based on
manual assembly processes or automatic processes for electrical Sanitary, irrigation and canteen usage represents 57% of the total.
components and subsets, it has low water consumption and a Industrial processes represent 30%.
negligible impact on water quality. This information enables more focused and dedicated action plans
Water is essentially used for sanitary purposes, sometimes for for a reduction in water consumption and also enables
cooling and, in certain sites, for surface treatment. In the latter normalization of information for more accurate performance
case, industrial water discharge is subject to treatments that are management: for instance, water used for sanitary and canteen will
suitable in terms of its pollutant potential and discharge into the be impacted by headcount evolution and water used for process
natural environment or in a plant subject to a monitoring plan. will be impacted by the evolution of production levels.
In2011 the Group initiated an analysis of industrial site positions
Energy consumption
relative to water stress in different regions throughout the world
See the Group’s energy consumption action plans on pages68-69.
using the WBCSD (World Business Council for Sustainable
Development) tool.
Raw material consumption
The Company’s «Everblue» project was launched in2012 and Schneider Electric focuses on making its devices more compact to
designed to better understand the uses of water within the Group, conserve natural resources so that customers have more
and therefore its exposure to water-related risks, and reduce environmentally friendly products to choose from. The Group has
consumption. Particular attention is paid to the developed design tools for managing thermal and electrical
highest-consumption sites and those located in areas of water constraints so that it can optimize the amount of materials required
stress, where the objectives of reducing water consumption in production. Each device’s Product Environmental Profile (PEP)
accompanied by specific action plans are reviewed, site by site. lists the materials used. To facilitate end-of-life processing,
In 2014 EverBlue encompassed 56sites that represent 62% of the Schneider Electric chooses materials that are easy to recycle and
Group’s total published consumption. clip-together components that are easy to disassemble. Life cycle
analyses and recyclability assessments also help the Group identify
Since January2013, Schneider Electric has measured and areas for improvement.
analyzed the quantities of water consumed by its sites on a
monthly basis and the different usages made of it (process, For more information on the Schneider Electric global action plan
HVAC/Heating Ventilation and Air Conditioning, Sanitary, Canteen, relating to PEP and end-of-life instructions, see the Green Premium
Irrigation). It continues to monitor the per capita consumption of chapter on pages70-72. Also see the Green Plastic program on
water on a like-for-like basis in order to evaluate the improvement page73.
performance from one year to the next.
In2014, the overall eco-efficient manufacturing approach allowed
the Group to reduce its per capita water consumption by 9.1% in
relation to2013 on a like-for-like basis. The target of 3.3% has
been exceeded. Note: water used for cooling is not included in this
calculation.
74 2014 REGISTRATION DOCUMENT SCHNEIDER ELECTRIC