APC 2014 Annual Report Download - page 48
Download and view the complete annual report
Please find page 48 of the 2014 APC annual report below. You can navigate through the pages in the report by either clicking on the pages listed below, or by using the keyword search tool below to find specific information within the annual report.-
 1
1 -
2
-
3
-
4
-
5
-
6
-
7
-
8
-
9
-
10
-
11
-
12
-
13
-
14
-
15
-
16
-
17
-
18
-
19
-
20
-
21
-
22
-
23
-
24
-
25
-
26
-
27
-
28
-
29
-
30
-
31
-
32
-
33
-
34
-
35
-
36
-
37
-
 38
38 -
 39
39 -
 40
40 -
 41
41 -
 42
42 -
 43
43 -
 44
44 -
 45
45 -
 46
46 -
 47
47 -
 48
48 -
 49
49 -
 50
50 -
 51
51 -
 52
52 -
 53
53 -
 54
54 -
 55
55 -
 56
56 -
 57
57 -
 58
58 -
59
-
60
-
61
-
62
-
63
-
64
-
65
-
66
-
67
-
68
-
69
-
70
-
71
-
72
-
73
-
74
-
75
-
76
-
77
-
78
-
79
-
80
-
81
-
82
-
83
-
84
-
85
-
86
-
87
-
88
-
89
-
90
-
91
-
92
-
93
-
94
-
95
-
96
-
97
-
98
-
99
-
100
-
101
-
102
-
103
-
104
-
105
-
106
-
107
-
108
-
109
-
110
-
111
-
112
-
113
-
114
-
115
-
116
-
117
-
118
-
119
-
120
-
121
-
122
-
123
-
124
-
125
-
126
-
127
-
128
-
129
-
130
-
131
-
132
-
133
-
134
-
135
-
136
-
137
-
138
-
139
-
140
-
141
-
142
-
143
-
144
-
145
-
146
-
147
-
148
-
149
-
150
-
151
-
152
-
153
-
154
-
155
-
156
-
157
-
158
-
159
-
160
-
161
-
162
-
163
-
164
-
165
-
166
-
167
-
168
-
169
-
170
-
171
-
172
-
173
-
174
-
175
-
176
-
177
-
178
-
179
-
180
-
181
-
182
-
183
-
184
-
185
-
186
-
187
-
188
-
189
-
190
-
191
-
192
-
193
-
194
-
195
-
196
-
197
-
198
-
199
-
200
-
201
-
202
-
203
-
204
-
205
-
206
-
207
-
208
-
209
-
210
-
211
-
212
-
213
-
214
-
215
-
216
-
217
-
218
-
219
-
220
-
221
-
222
-
223
-
224
-
225
-
226
-
227
-
228
-
229
-
230
-
231
-
232
-
233
-
234
-
235
-
236
-
237
-
238
-
239
-
240
-
241
-
242
-
243
-
244
-
245
-
246
-
247
-
248
-
249
-
250
-
251
-
252
-
253
-
254
-
255
-
256
-
257
-
258
-
259
-
260
-
261
-
262
-
263
-
264
-
265
-
266
-
267
-
268
-
269
-
270
-
271
-
272
-
273
-
274
-
275
-
276
-
277
-
278
-
279
-
280
-
281
-
282
-
283
-
284
-
285
-
286
-
287
-
288
-
289
-
290
-
291
-
292
-
293
-
294
-
295
-
296
-
297
-
298
-
299
-
300
-
301
-
302
-
303
-
304
-
305
-
306
-
307
-
308
-
309
-
310
-
311
-
312
-
313
-
314
-
315
-
316
-
317
-
318
-
319
-
320
-
321
-
322
-
323
-
324
-
325
-
326
-
327
-
328
-
329
-
330
-
331
-
332
-
333
-
334
-
335
-
336
 |
 |

2SUSTAINABLE DEVELOPMENT
SUSTAINABLE DEVELOPMENT AT THE HEART OF OUR STRATEGY
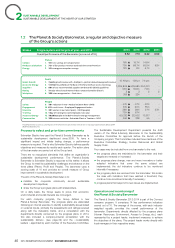
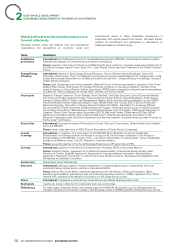
The Planet&Society Barometer, a regular and objective measure
1.2
oftheGroup’s actions
9.52 7.51 6.42 3.00
16%
79%
13%
16.7%
68.7%
8%
14.8%
65.5%
6.1%
-
63%
-
10.48 pts -
- 61% -
61% -
28% 23%
79% -
60,232 -
460
- 47%
60%
28%
67%
32,602
228
- 23%
55%
27%
-
10,517
66 -
1,095,806 -
63% -
3 3
355
1.28 pt
695,685
18.8%
3
224
7.6 pts
344,441
7.8%
3
- -
Planet
1. 10% CO2 savings on transportation
2. 75% of our product revenue achieved with Green Premium
3. 10% energy consumption savings
Carbon
Products & Solutions
Energy
Green Growth
Access to Energy
Suppliers
Rating
Workplace
Safety
Engagement
Diversity
Training
Access to Energy
Communities
Profit
4.
7 points growth revenue with « EcoXperts » partners above Group growth revenue
5. 1 million households at the Base of the Pyramid have access to energy
6. 90% of our recommended suppliers embrace ISO 26000 guidelines
7. 3 major ethical stock market indices choose Schneider Electric
8. 300 sites recognized as « Cool sites »
People
9. 30% reduction in the « Medical Incident Rate » (MIR)
10. 63% result in our « Employee Engagement Index »
11. 30% women in our talent pool (~ 2,500 people)
12. 1 day of training for each employee every year
13. 30,000 people at the BoP trained in energy management
14. 300 missions with the « Schneider Electric Teachers » NGO
Overall performance of the Barometer (score out of 10)
Stakes Progress plans and targets at year-end 2014
The 2011 performance serves as a starting value for the Planet & Society barometer of the Connect company program between 2012 and 2014.
2014 audited indicators.
2014 2013 2012 2011
Process to select and prioritize commitments
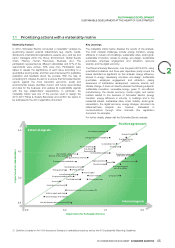
The Sustainable Development Department presents the draft
version of the Planet&Society Barometer to the Sustainability
Schneider Electric has used the Planet&Society Barometer as its Executive Committee for approval before the launch of the
sustainable development dashboard since2005. To have a Company program. This Committee includes three members of the
significant impact and initiate lasting change, a performance Executive Committee: Strategy, Human Resources and Global
measure is required. That is why Schneider Electric defines specific Supply Chain.
objectives and measures its results each quarter. The action plans Four cases may be included from one barometer to the next:
of the barometer are carried out at the Group level.
the progress plans are maintained in the barometer and their
l
There are no recognized standards that define an organization’s targets are renewed or increased;
sustainable development performance. The Planet&Society
the progress plans change, new and more innovative or better
l
Barometer is Schneider Electric’s response to this matter. It allows
adapted indicators that cover the same subject are
the Group to meet its sustainability challenges and advance on the
implemented; the old indicators continue to be monitored
three pillars (Planet, Profit and People). The barometer uses a
internally if necessary;
scoring scale of 10 and provides an overall measure of Group
improvement in sustainable development. the progress plans are removed from the barometer; this is also
l
the case with indicators that have reached a threshold; they
The aim of the Planet&Society Barometer is to: continue to be monitored internally if necessary;
mobilize the corporate community around sustainable
l
progress plans that respond to new issues are implemented.
l
development objectives;
Operation and monitoring of
share the Group’s progress plans with stakeholders.
l
On a daily basis, the Group seeks to prove that economic,
thePlanet&Society Barometer
environmental and social interests are convergent.
For each company program, the Group defines a new The Planet&Society Barometer 2012-2014 is part of the Connect
Planet&Society Barometer. The progress plans are elaborated company program. It comprises 14 key performance indicators
following an internal exercise to identify sustainability issues based scored out of 10. The average of the scores, with each indicator
on external inputs, primarily the assessments and ratings received weighted equally, provides the overall performance of the
along with the materiality matrix, and a consultation with the barometer. Departments directly affected by the progress plans
departments directly concerned by the progress plans. In 2014, (Human Resources, Environment, Access to Energy,etc.), each
this also included a company-internal consultation with the represented by a project leader, implement measures to achieve
sustainability fellows» (see page49) and the «sustainability the objectives of the plans. This project leader works directly with
leaders» appointed by each member of the Executive Committee. local managers in their respective areas.
46 2014 REGISTRATION DOCUMENT SCHNEIDER ELECTRIC