APC 2014 Annual Report Download - page 9
Download and view the complete annual report
Please find page 9 of the 2014 APC annual report below. You can navigate through the pages in the report by either clicking on the pages listed below, or by using the keyword search tool below to find specific information within the annual report.-
 1
1 -
 2
2 -
 3
3 -
 4
4 -
 5
5 -
 6
6 -
 7
7 -
 8
8 -
 9
9 -
 10
10 -
 11
11 -
 12
12 -
 13
13 -
 14
14 -
 15
15 -
 16
16 -
 17
17 -
 18
18 -
 19
19 -
 20
20 -
21
-
22
-
23
-
24
-
25
-
26
-
27
-
28
-
29
-
30
-
31
-
32
-
33
-
34
-
35
-
36
-
37
-
38
-
39
-
40
-
41
-
42
-
43
-
44
-
45
-
46
-
47
-
48
-
49
-
50
-
51
-
52
-
53
-
54
-
55
-
56
-
57
-
58
-
59
-
60
-
61
-
62
-
63
-
64
-
65
-
66
-
67
-
68
-
69
-
70
-
71
-
72
-
73
-
74
-
75
-
76
-
77
-
78
-
79
-
80
-
81
-
82
-
83
-
84
-
85
-
86
-
87
-
88
-
89
-
90
-
91
-
92
-
93
-
94
-
95
-
96
-
97
-
98
-
99
-
100
-
101
-
102
-
103
-
104
-
105
-
106
-
107
-
108
-
109
-
110
-
111
-
112
-
113
-
114
-
115
-
116
-
117
-
118
-
119
-
120
-
121
-
122
-
123
-
124
-
125
-
126
-
127
-
128
-
129
-
130
-
131
-
132
-
133
-
134
-
135
-
136
-
137
-
138
-
139
-
140
-
141
-
142
-
143
-
144
-
145
-
146
-
147
-
148
-
149
-
150
-
151
-
152
-
153
-
154
-
155
-
156
-
157
-
158
-
159
-
160
-
161
-
162
-
163
-
164
-
165
-
166
-
167
-
168
-
169
-
170
-
171
-
172
-
173
-
174
-
175
-
176
-
177
-
178
-
179
-
180
-
181
-
182
-
183
-
184
-
185
-
186
-
187
-
188
-
189
-
190
-
191
-
192
-
193
-
194
-
195
-
196
-
197
-
198
-
199
-
200
-
201
-
202
-
203
-
204
-
205
-
206
-
207
-
208
-
209
-
210
-
211
-
212
-
213
-
214
-
215
-
216
-
217
-
218
-
219
-
220
-
221
-
222
-
223
-
224
-
225
-
226
-
227
-
228
-
229
-
230
-
231
-
232
-
233
-
234
-
235
-
236
-
237
-
238
-
239
-
240
-
241
-
242
-
243
-
244
-
245
-
246
-
247
-
248
-
249
-
250
-
251
-
252
-
253
-
254
-
255
-
256
-
257
-
258
-
259
-
260
-
261
-
262
-
263
-
264
-
265
-
266
-
267
-
268
-
269
-
270
-
271
-
272
-
273
-
274
-
275
-
276
-
277
-
278
-
279
-
280
-
281
-
282
-
283
-
284
-
285
-
286
-
287
-
288
-
289
-
290
-
291
-
292
-
293
-
294
-
295
-
296
-
297
-
298
-
299
-
300
-
301
-
302
-
303
-
304
-
305
-
306
-
307
-
308
-
309
-
310
-
311
-
312
-
313
-
314
-
315
-
316
-
317
-
318
-
319
-
320
-
321
-
322
-
323
-
324
-
325
-
326
-
327
-
328
-
329
-
330
-
331
-
332
-
333
-
334
-
335
-
336
 |
 |

T
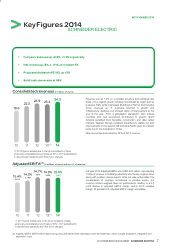
KEY FIGURES 2014
Figures 2014
Key
SCHNEIDER ELECTRIC
Full year revenues up +6.6%, +1.4% organically
•
Net income up +3%, c. +11% at constant FX
•
Proposed dividend of €1.92, up +3%
•
Solid cash conversion at 96%
•
Consolidated revenues (in billions of euros)
12
22.3
10 11
19.6
13(1)
23.9
14
23.4
24.9
(1) 2013 figures restated due to the full consolidation of Delixi
(previously consolidated proportionally at 50%), CST reclassification
in discontinued operations and other minor changes.
Revenue was up 1.4% on a constant structure and exchange rate
basis. 2014 organic growth remained contrasted by region and by
business. Early cycle businesses (Buildings & Partner and Industry)
drove revenues up, IT business returned to growth and
Infrastructure declined, but showed signs of improvement at the
end of the year. From a geographic standpoint, both mature
countries and new economies contributed to growth. North
America benefited from favorable construction and data center
markets, Western Europe remained impacted by utilities but saw
improvements in the second half and Asia-Pacific grew at a slower
pace due to the slowdown in China.
New economies accounted for 44% of 2014 revenue.
Adjusted EBITA(2) (in millions of euros and as a % of revenue)
1210 11
15.4%
3,019
14.3%
3 ,190
13(1)
14.7%
3,515
14
14.3%
3,356
13.9%
3,463
(1) 2013 figures restated due to the full consolidation of Delixi
(previously consolidated proportionally at 50%), CST reclassification
in discontinued operations and other minor changes.
Full year 2014 adjusted EBITA was EUR3,463 million, representing
13.9% of revenue. Industrial productivity was the key organic driver
along with positive volume impact, while mix was unfavorable. The
consolidation of Invensys contributed to positive scope, but
currency impact weighed down on performance, leading to a 0.4
point decline in adjusted EBITA margin versus 2013 restated
margin. At constant FX, adjusted EBITA margin was stable.
Adjusted EBITA: EBITA before restructuring costs and before other operating income and expenses, which includes acquisition, integration and (2)
separation costs.
7
2014 REGISTRATION DOCUMENT SCHNEIDER ELECTRIC