APC 2014 Annual Report Download - page 118
Download and view the complete annual report
Please find page 118 of the 2014 APC annual report below. You can navigate through the pages in the report by either clicking on the pages listed below, or by using the keyword search tool below to find specific information within the annual report.-
 1
1 -
2
-
3
-
4
-
5
-
6
-
7
-
8
-
9
-
10
-
11
-
12
-
13
-
14
-
15
-
16
-
17
-
18
-
19
-
20
-
21
-
22
-
23
-
24
-
25
-
26
-
27
-
28
-
29
-
30
-
31
-
32
-
33
-
34
-
35
-
36
-
37
-
38
-
39
-
40
-
41
-
42
-
43
-
44
-
45
-
46
-
47
-
48
-
49
-
50
-
51
-
52
-
53
-
54
-
55
-
56
-
57
-
58
-
59
-
60
-
61
-
62
-
63
-
64
-
65
-
66
-
67
-
68
-
69
-
70
-
71
-
72
-
73
-
74
-
75
-
76
-
77
-
78
-
79
-
80
-
81
-
82
-
83
-
84
-
85
-
86
-
87
-
88
-
89
-
90
-
91
-
92
-
93
-
94
-
95
-
96
-
97
-
98
-
99
-
100
-
101
-
102
-
103
-
104
-
105
-
106
-
107
-
 108
108 -
 109
109 -
 110
110 -
 111
111 -
 112
112 -
 113
113 -
 114
114 -
 115
115 -
 116
116 -
 117
117 -
 118
118 -
 119
119 -
 120
120 -
 121
121 -
 122
122 -
 123
123 -
 124
124 -
 125
125 -
 126
126 -
 127
127 -
 128
128 -
129
-
130
-
131
-
132
-
133
-
134
-
135
-
136
-
137
-
138
-
139
-
140
-
141
-
142
-
143
-
144
-
145
-
146
-
147
-
148
-
149
-
150
-
151
-
152
-
153
-
154
-
155
-
156
-
157
-
158
-
159
-
160
-
161
-
162
-
163
-
164
-
165
-
166
-
167
-
168
-
169
-
170
-
171
-
172
-
173
-
174
-
175
-
176
-
177
-
178
-
179
-
180
-
181
-
182
-
183
-
184
-
185
-
186
-
187
-
188
-
189
-
190
-
191
-
192
-
193
-
194
-
195
-
196
-
197
-
198
-
199
-
200
-
201
-
202
-
203
-
204
-
205
-
206
-
207
-
208
-
209
-
210
-
211
-
212
-
213
-
214
-
215
-
216
-
217
-
218
-
219
-
220
-
221
-
222
-
223
-
224
-
225
-
226
-
227
-
228
-
229
-
230
-
231
-
232
-
233
-
234
-
235
-
236
-
237
-
238
-
239
-
240
-
241
-
242
-
243
-
244
-
245
-
246
-
247
-
248
-
249
-
250
-
251
-
252
-
253
-
254
-
255
-
256
-
257
-
258
-
259
-
260
-
261
-
262
-
263
-
264
-
265
-
266
-
267
-
268
-
269
-
270
-
271
-
272
-
273
-
274
-
275
-
276
-
277
-
278
-
279
-
280
-
281
-
282
-
283
-
284
-
285
-
286
-
287
-
288
-
289
-
290
-
291
-
292
-
293
-
294
-
295
-
296
-
297
-
298
-
299
-
300
-
301
-
302
-
303
-
304
-
305
-
306
-
307
-
308
-
309
-
310
-
311
-
312
-
313
-
314
-
315
-
316
-
317
-
318
-
319
-
320
-
321
-
322
-
323
-
324
-
325
-
326
-
327
-
328
-
329
-
330
-
331
-
332
-
333
-
334
-
335
-
336
 |
 |

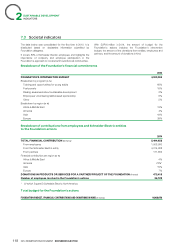
2SUSTAINABLE DEVELOPMENT
INDICATORS
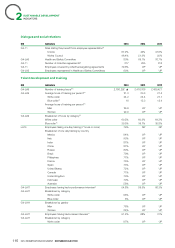
Dialogue and social relations
GRI Indicators 2014 2013 2012
G4-11 Sites stating they benefit from employee representation(5)
Unions 67.2% 44% 47.6%
Works Council 46.4% 51.3% 50%
G4-LA5 Health and Safety Committee 80% 69.1% 76.7%
G4-11 Number of collective agreements(5) 217 265 315
G4-11 Employees covered by collective bargaining agreements 79.6% UP UP
G4-LA5 Employees represented in Health and Safety Committees 80% UP UP
Talent development and training
GRI Indicators 2014 2013 2012
G4-LA9 Number of training hours(10) 2,756,292 ▲2,416,766 2,489,421
G4-LA9 Average hours of training per person(10) 21.3 20.3 21.5
White collar 24.2 24.4 27.7
Blue collar(7) 18 15.3 15.4
Average hours of training per person(10)
Man 26.6 UP UP
Women 22.9 UP UP
G4-LA9 Breakdown of hours by category(2)
White collar 60.5% 60.3% 64.2%
Blue collar(7) 39.5% 39.7% 35.8%
LA10 Employees taking one day training (7 hours or more) 79% NP NP
Breakdown of one day training by country
Mexico 94% UP UP
Italy 93% UP UP
India 87% UP UP
China 87% UP UP
Russia 80% UP UP
Brazil 79% UP UP
Philippines 77% UP UP
France 75% UP UP
Spain 73% UP UP
United States 72% UP UP
Canada 71% UP UP
United Kingdom 70% UP UP
Indonesia 70% UP UP
Australia 58% UP UP
G4-LA11 Employees having had a performance interview(3) 54.8% 59.5% 66.3%
G4-LA11 Breakdown by category
White collar 95% UP UP
Blue collar 5% UP UP
G4-LA11 Breakdown by gender
Men 76% UP UP
Women 24% UP UP
G4-LA11 Employees having had a career interview(3) 51.2% 68% 31%
G4-LA11 Breakdown by category
White collar 97% UP UP
116 2014 REGISTRATION DOCUMENT SCHNEIDER ELECTRIC