APC 2014 Annual Report Download - page 258
Download and view the complete annual report
Please find page 258 of the 2014 APC annual report below. You can navigate through the pages in the report by either clicking on the pages listed below, or by using the keyword search tool below to find specific information within the annual report.-
 1
1 -
2
-
3
-
4
-
5
-
6
-
7
-
8
-
9
-
10
-
11
-
12
-
13
-
14
-
15
-
16
-
17
-
18
-
19
-
20
-
21
-
22
-
23
-
24
-
25
-
26
-
27
-
28
-
29
-
30
-
31
-
32
-
33
-
34
-
35
-
36
-
37
-
38
-
39
-
40
-
41
-
42
-
43
-
44
-
45
-
46
-
47
-
48
-
49
-
50
-
51
-
52
-
53
-
54
-
55
-
56
-
57
-
58
-
59
-
60
-
61
-
62
-
63
-
64
-
65
-
66
-
67
-
68
-
69
-
70
-
71
-
72
-
73
-
74
-
75
-
76
-
77
-
78
-
79
-
80
-
81
-
82
-
83
-
84
-
85
-
86
-
87
-
88
-
89
-
90
-
91
-
92
-
93
-
94
-
95
-
96
-
97
-
98
-
99
-
100
-
101
-
102
-
103
-
104
-
105
-
106
-
107
-
108
-
109
-
110
-
111
-
112
-
113
-
114
-
115
-
116
-
117
-
118
-
119
-
120
-
121
-
122
-
123
-
124
-
125
-
126
-
127
-
128
-
129
-
130
-
131
-
132
-
133
-
134
-
135
-
136
-
137
-
138
-
139
-
140
-
141
-
142
-
143
-
144
-
145
-
146
-
147
-
148
-
149
-
150
-
151
-
152
-
153
-
154
-
155
-
156
-
157
-
158
-
159
-
160
-
161
-
162
-
163
-
164
-
165
-
166
-
167
-
168
-
169
-
170
-
171
-
172
-
173
-
174
-
175
-
176
-
177
-
178
-
179
-
180
-
181
-
182
-
183
-
184
-
185
-
186
-
187
-
188
-
189
-
190
-
191
-
192
-
193
-
194
-
195
-
196
-
197
-
198
-
199
-
200
-
201
-
202
-
203
-
204
-
205
-
206
-
207
-
208
-
209
-
210
-
211
-
212
-
213
-
214
-
215
-
216
-
217
-
218
-
219
-
220
-
221
-
222
-
223
-
224
-
225
-
226
-
227
-
228
-
229
-
230
-
231
-
232
-
233
-
234
-
235
-
236
-
237
-
238
-
239
-
240
-
241
-
242
-
243
-
244
-
245
-
246
-
247
-
 248
248 -
 249
249 -
 250
250 -
 251
251 -
 252
252 -
 253
253 -
 254
254 -
 255
255 -
 256
256 -
 257
257 -
 258
258 -
 259
259 -
 260
260 -
 261
261 -
 262
262 -
 263
263 -
 264
264 -
 265
265 -
 266
266 -
 267
267 -
 268
268 -
269
-
270
-
271
-
272
-
273
-
274
-
275
-
276
-
277
-
278
-
279
-
280
-
281
-
282
-
283
-
284
-
285
-
286
-
287
-
288
-
289
-
290
-
291
-
292
-
293
-
294
-
295
-
296
-
297
-
298
-
299
-
300
-
301
-
302
-
303
-
304
-
305
-
306
-
307
-
308
-
309
-
310
-
311
-
312
-
313
-
314
-
315
-
316
-
317
-
318
-
319
-
320
-
321
-
322
-
323
-
324
-
325
-
326
-
327
-
328
-
329
-
330
-
331
-
332
-
333
-
334
-
335
-
336
 |
 |

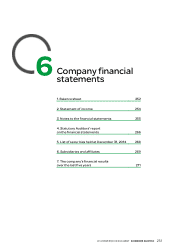
6COMPANY FINANCIAL STATEMENTS
NOTES TO THE FINANCIAL STATEMENTS
As part of the first application of the recommendation of the ANC
Currency risk
No. 2013-02, the company has decided to account for all of these Where necessary, a contingency provision is in place for unrealized
plans, all the unrecognized actuarial gains and losses and exchange losses. However, where there are unrealized exchange
unrecognized past service costs as of the opening date of the year gains and losses on back-to-back transactions in the same
of change, that is to say January 1, 2014, directly through the currency and with the same maturity, the amount of the provision
retained earnings account. is then limited to the net loss.
Impacts and explanations on how to calculate this provision are
Bonds
given in note 8.2 – Liabilities related to pensions.
Redemption premiums and issue costs are amortized over the life
of the bonds.
Non-current assets
Note1
1.1 – Intangible assets
This item primarily consists of share issue and merger expenses, which are fully amortized.
1.2 – Tangible assets
(in thousands of euros)
Tangible assets Dec.31, 2013 Additions Disposals Dec.31, 2014
Cost 4,450 - (2) 4,448
Depreciation (290) - - (290)
NET 4,160 - (2) 4,158
Investments
Note2
2.1 – Shares in subsidiaries and affiliates
(in thousands of euros)
Shares in subsidiaries and affiliates Dec.31, 2013 Additions Disposals Dec.31, 2014
Cost 4,601,996 1,998,135 (1,000,157) 5,599,974
Provisions (114,264) (1,100) 1,094 (114,270)
NET 4,487,732 1,997,035 (999,063) 5,485,704
The main changes over the financial year are mainly related to:
contribution of Invensys shares, acquired through capital increase of Schneider Electric SE, to its subsidiary Samos for EUR999million;
l
contribution of the company Samos shares, for its book value of EUR999million, to Schneider Electric Industries SAS, through capital increase.
l
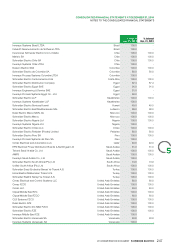
The main investments at December 31, 2014 were as follows:
Shares in subsidiaries and affiliates Carrying value
Schneider Electric IndustriesSAS 5,343,544
Cofimines 139,073
Schneider Electric Japan Holding 2,049
Other (less than EUR5million) 1,038
TOTAL 5,485,704
256 2014 REGISTRATION DOCUMENT SCHNEIDER ELECTRIC