American Express 2014 Annual Report Download - page 106
Download and view the complete annual report
Please find page 106 of the 2014 American Express annual report below. You can navigate through the pages in the report by either clicking on the pages listed below, or by using the keyword search tool below to find specific information within the annual report.-
 1
1 -
2
-
3
-
4
-
5
-
6
-
7
-
8
-
9
-
10
-
11
-
12
-
13
-
14
-
15
-
16
-
17
-
18
-
19
-
20
-
21
-
22
-
23
-
24
-
25
-
26
-
27
-
28
-
29
-
30
-
31
-
32
-
33
-
34
-
35
-
36
-
37
-
38
-
39
-
40
-
41
-
42
-
43
-
44
-
45
-
46
-
47
-
48
-
49
-
50
-
51
-
52
-
53
-
54
-
55
-
56
-
57
-
58
-
59
-
60
-
61
-
62
-
63
-
64
-
65
-
66
-
67
-
68
-
69
-
70
-
71
-
72
-
73
-
74
-
75
-
76
-
77
-
78
-
79
-
80
-
81
-
82
-
83
-
84
-
85
-
86
-
87
-
88
-
89
-
90
-
91
-
92
-
93
-
94
-
95
-
 96
96 -
 97
97 -
 98
98 -
 99
99 -
 100
100 -
 101
101 -
 102
102 -
 103
103 -
 104
104 -
 105
105 -
 106
106 -
 107
107 -
 108
108 -
 109
109 -
 110
110 -
 111
111 -
 112
112 -
 113
113 -
 114
114 -
 115
115 -
 116
116 -
117
-
118
-
119
-
120
-
121
-
122
-
123
-
124
-
125
-
126
-
127
-
128
-
129
-
130
 |
 |

AMERICAN EXPRESS COMPANY
NOTES TO CONSOLIDATED FINANCIAL STATEMENTS
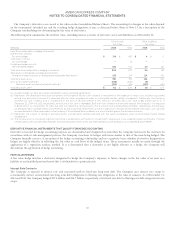
FINANCIAL ASSETS AND FINANCIAL LIABILITIES CARRIED AT OTHER THAN FAIR VALUE
ThefollowingtabledisclosestheestimatedfairvaluefortheCompany’sfinancial assets and financial liabilities that are not required to be
carried at fair value on a recurring basis, as of December 31, 2014 and 2013:
Carrying
Value
Corresponding Fair Value Amount
2014 (Billions) Total Level 1 Level 2 Level 3
Financial Assets:
Financial assets for which carrying values equal or approximate fair value
Cash and cash equivalents $22$22$ 21$ 1
(a) $—
Other financial assets(b) 48 48 — 48 —
Financial assets carried at other than fair value
Loans, net 70 71(c) —— 71
Financial Liabilities:
Financial liabilities for which carrying values equal or approximate fair value 61 61 — 61 —
Financial liabilities carried at other than fair value
Certificates of deposit(d) 88—8 —
Long-term debt
$58$60
(c) $—$60
$—
—
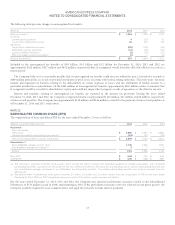
Carrying
Value
Corresponding Fair Value Amount
2013 (Billions) Total Level 1 Level 2 Level 3
Financial Assets:
Financial assets for which carrying values equal or approximate fair value
Cash and cash equivalents $ 19 $ 19 $ 17 $ 2(a) $—
Other financial assets(b) 48 48 — 48 —
Financial assets carried at other than fair value
Loans, net 67 67(c) —— 67
Financial Liabilities:
Financial liabilities for which carrying values equal or approximate fair value 60 60 — 60 —
Financial liabilities carried at other than fair value
Certificates of deposit(d) 78—8 —
Long-term debt $ 55 $ 58(c) $—$58$ —
(a) Reflects time deposits.
(b) Includes accounts receivable (including fair values of Card Member receivables of $7.0 billion and $7.3 billion held by consolidated VIEs as of December 31, 2014
and 2013, respectively), restricted cash and other miscellaneous assets.
(c) Includes fair values of loans of $29.9 billion and $31.0 billion, and long-term debt of $19.5 billion and $18.8 billion, held by consolidated VIEs as of December 31,
2014 and 2013, respectively.
(d) Presented as a component of customer deposits on the Consolidated Balance Sheets.
The fair values of these financial instruments are estimates based upon the market conditions and perceived risks as of December 31, 2014,
and require management judgment. These figures may not be indicative of future fair values. The fair value of the Company cannot be
reliably estimated by aggregating the amounts presented.
106