American Express 2014 Annual Report Download - page 20
Download and view the complete annual report
Please find page 20 of the 2014 American Express annual report below. You can navigate through the pages in the report by either clicking on the pages listed below, or by using the keyword search tool below to find specific information within the annual report.-
 1
1 -
2
-
3
-
4
-
5
-
6
-
7
-
8
-
9
-
 10
10 -
 11
11 -
 12
12 -
 13
13 -
 14
14 -
 15
15 -
 16
16 -
 17
17 -
 18
18 -
 19
19 -
 20
20 -
 21
21 -
 22
22 -
 23
23 -
 24
24 -
 25
25 -
 26
26 -
 27
27 -
 28
28 -
 29
29 -
 30
30 -
31
-
32
-
33
-
34
-
35
-
36
-
37
-
38
-
39
-
40
-
41
-
42
-
43
-
44
-
45
-
46
-
47
-
48
-
49
-
50
-
51
-
52
-
53
-
54
-
55
-
56
-
57
-
58
-
59
-
60
-
61
-
62
-
63
-
64
-
65
-
66
-
67
-
68
-
69
-
70
-
71
-
72
-
73
-
74
-
75
-
76
-
77
-
78
-
79
-
80
-
81
-
82
-
83
-
84
-
85
-
86
-
87
-
88
-
89
-
90
-
91
-
92
-
93
-
94
-
95
-
96
-
97
-
98
-
99
-
100
-
101
-
102
-
103
-
104
-
105
-
106
-
107
-
108
-
109
-
110
-
111
-
112
-
113
-
114
-
115
-
116
-
117
-
118
-
119
-
120
-
121
-
122
-
123
-
124
-
125
-
126
-
127
-
128
-
129
-
130
 |
 |
AMERICAN EXPRESS COMPANY
2014 FINANCIAL REVIEW
CURRENT BUSINESS ENVIRONMENT/OUTLOOK
Our results for 2014 reflect higher spending by our Card Members, growth in average Card Member loans, credit quality indicators at or near
historical lows and continued control over operating expenses, while our strong balance sheet allowed us to return a substantial amount of
capital to our shareholders. We believe we produced solid earnings given the current economic and competitive environment, but recognize
we face a number of increasing challenges in 2015.
In 2014, we exceeded $1 trillion in annual Card Member global spend on our network for the first time. Card Member billed business
increased 7 percent annually over the prior year, with a modest deceleration of the growth rate in the fourth quarter. Discount revenue
increased 4 percent annually over the prior year. Billed business growth outpaced discount revenue growth primarily due to accelerated
growth of our GNS business (where we share discount revenue we earn from merchants with our issuing bank partners), certain contract
signings and payments made to corporate clients and merchant partners, strong growth in our cash rebate rewards products and changes in
the mix of spending by location and industry. These factors as well as competition and pricing regulation (including regulation of
competitors’ interchange rates) will likely result in a continuation of this trend over time.
Average loans grew 4 percent during 2014, which, along with lower funding costs, led to an 8 percent increase in net interest income. Net
write-off rates remained at or near historically low levels, though the overall rate of improvement slowed in 2014. We expect, at some point,
net write-off rates will increase from these historic lows, which will result in a growth in provision for losses assuming average loans remain
at or above current levels.
As previously noted, our 2014 results include net gains from the business travel joint venture transaction in the second quarter ($626
million pretax) and the sale of our investment in Concur in the fourth quarter ($719 million pretax). We used a substantial portion of those
gains to make additional investments in business building activities and initiatives designed to improve operating efficiencies. Specifically,
marketing, promotion and rewards expenses reflect incremental investments, as well as a charge related to the renewal of our long-term
relationship with Delta. We also undertook restructuring actions in the second quarter ($133 million pretax) and fourth quarter ($313
million pretax) designed to make us more efficient, contain operating expenses, and, as a result, better enable us to invest in new and
enhanced products and services.
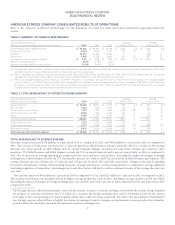
Operating expenses for the year decreased 6 percent and adjusted operating expenses, a non-GAAP measure, were flat year over year. Refer
to Table 1 for details of adjusted operating expenses.
While our business is diversified by product and geography, including a range of consumer and commercial card offerings, a large
international business and GNS partners around the world, we face a number of increasing challenges in 2015.
Regulation of the payments industry has increased significantly in recent years and various governments around the world have
established or are proposing to establish payment system regulatory regimes. In the European Union (EU), proposed regulatory changes in
the card payment sector, including the introduction of price regulation, the elimination of honor-all-cards and “anti-steering” rules, and
requirements on granting access to our network, among other important changes, will likely negatively impact the discount revenue derived
from our business in the EU and could significantly limit our flexibility to compete with the more entrenched bankcard networks. See
‘‘Certain Legislative, Regulatory and Other Developments” for additional information on the legislative and regulatory environment.
In addition, global economic growth continues at a modest and mixed pace. Our 2014 results were negatively impacted by the
strengthening U.S. dollar, and we currently expect foreign exchange to have an adverse impact in 2015. Our results could be adversely
affected by increases in short-term interest rates or the failure of the U.S. Congress to continue the renewal of legislation regarding our active
financing income, which could increase our effective tax rate and have an adverse impact on net income in 2015 and beyond.
Competition remains extremely intense across the payments industry. Within the co-brand space, we are focusing on those relationships
that offer the best value to our Card Members while also providing appropriate returns to our business and shareholders. We recently
renewed and extended our relationships with Delta, Starwood and Cathay Pacific. More intense competition has generally increased our cost
of renewing and extending co-brand relationships which are an important component of our business model. We will continue to strive for a
diverse and balanced portfolio of product categories.
20