American Express 2014 Annual Report Download - page 34
Download and view the complete annual report
Please find page 34 of the 2014 American Express annual report below. You can navigate through the pages in the report by either clicking on the pages listed below, or by using the keyword search tool below to find specific information within the annual report.-
 1
1 -
2
-
3
-
4
-
5
-
6
-
7
-
8
-
9
-
10
-
11
-
12
-
13
-
14
-
15
-
16
-
17
-
18
-
19
-
20
-
21
-
22
-
23
-
 24
24 -
 25
25 -
 26
26 -
 27
27 -
 28
28 -
 29
29 -
 30
30 -
 31
31 -
 32
32 -
 33
33 -
 34
34 -
 35
35 -
 36
36 -
 37
37 -
 38
38 -
 39
39 -
 40
40 -
 41
41 -
 42
42 -
 43
43 -
 44
44 -
45
-
46
-
47
-
48
-
49
-
50
-
51
-
52
-
53
-
54
-
55
-
56
-
57
-
58
-
59
-
60
-
61
-
62
-
63
-
64
-
65
-
66
-
67
-
68
-
69
-
70
-
71
-
72
-
73
-
74
-
75
-
76
-
77
-
78
-
79
-
80
-
81
-
82
-
83
-
84
-
85
-
86
-
87
-
88
-
89
-
90
-
91
-
92
-
93
-
94
-
95
-
96
-
97
-
98
-
99
-
100
-
101
-
102
-
103
-
104
-
105
-
106
-
107
-
108
-
109
-
110
-
111
-
112
-
113
-
114
-
115
-
116
-
117
-
118
-
119
-
120
-
121
-
122
-
123
-
124
-
125
-
126
-
127
-
128
-
129
-
130
 |
 |

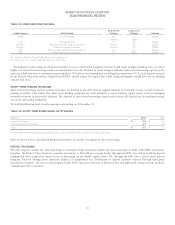
AMERICAN EXPRESS COMPANY
2014 FINANCIAL REVIEW
TABLE 13: ICS SELECTED STATISTICAL INFORMATION
As of or for the Years Ended December 31,
(Millions, except percentages and where indicated) 2014 2013 2012
Change
2014 vs. 2013
Change
2013 vs. 2012
Card billed business (billions) $ 133.8 $ 131.7 $ 128.9 2 % 2 %
Total cards-in-force 15.7 15.7 15.6 — 1
Basic cards-in-force 11.0 10.7 10.6 3 1
Average basic Card Member spending (dollars)*$ 12,297 $ 12,429 $ 12,221 (1) 2
International Consumer Travel:
Travel sales $1,422$ 1,420 $ 1,372 — 3
Travel commissions and fees/sales 6.8 % 6.9 % 7.2 %
Total segment assets (billions) $30.7$31.1$31.8 (1) (2)
Segment capital $2,948$ 3,132 $ 2,875 (6) 9
Return on average segment capital(a) 13.6 % 20.9 % 21.8 %
Return on average tangible segment capital(a) 24.6 % 38.8 % 43.0 %
Card Member receivables:
Total receivables (billions) $7.7$7.8$7.8 (1) —
Net write-off rate – principal only(c) 1.9 % (b) (b)
Net write-off rate – principal and fees(c) 2.1 % (b) (b)
30 days past due as a % of total 1.3 % (b) (b)
90 days past billing as a % of total (b) 1.1 % 0.9 %
Netlossratio(asa%ofchargevolume) (b) 0.20 % 0.16 %
Card Member loans:
Total loans (billions) $7.7$ 8.8 $ 9.2 (13)% (4)%
Net write-off rate – principal only(c) 2.0 % 1.9 % 1.9 %
Net write-off rate – principal, interest and fees(c) 2.4 % 2.3 % 2.4 %
30 days past due as a % of total 1.6 % 1.4 % 1.5 %
Calculation of Net Interest Yield on Card Member Loans:
Net interest income $755$757$745
Exclude:
Interest expense not attributable to the Company’s
Card Member loan portfolio 89 93 102
Interest income not attributable to the Company’s
Card Member loan portfolio (39) (29) (25)
Adjusted net interest income(d) $805$ 821 $ 822
Average loans (billions) $8.2$ 8.5 $ 8.7
Exclude certain non-traditional Card Member loans and other fees (billions) (0.2) (0.2) (0.2)
Adjusted average loans (billions)(d) $8.0$ 8.3 $ 8.5
Net interest income divided by average loans 9.2 % 8.9 % 8.5 %
Net interest yield on Card Member loans(d) 10.0 % 9.9 % 9.6 %
* Proprietary cards only.
(a) Return on average segment capital is calculated by dividing (i) one-year period segment income ($411 million, $631 million and $634 million for 2014, 2013 and
2012, respectively) by (ii) one-year average segment capital ($3.0 billion for both 2014 and 2013 and $2.9 billion for 2012). Return on average tangible segment
capital, a non-GAAP measure, is computed in the same manner as return on average segment capital except the computation of average tangible segment
capital, a non-GAAP measure, excludes from average segment capital average goodwill and other intangibles of $1.4 billion at December 31, 2014, 2013 and
2012. We believe return on average tangible segment capital is a useful measure of the profitability of our business.
(b) Historically, due to system constraints, net loss ratio as a % of charge volume and 90 days past billing as a % of receivables were presented. Beginning in the
first quarter of 2014, as a result of system enhancements, net write-off rate — principal only, net write-off rate — principal and fees and 30 days past due as a %
of total are presented.
(c) Refer to Table 8 footnote (e).
(d) Adjusted net interest income, adjusted average loans and net interest yield on Card Member loans are non-GAAP measures. We believe adjusted net interest
income and adjusted average loans are useful to investors because they are components of net interest yield on Card Member loans, which provides a measure
of profitability of our Card Member loan portfolio.
34