American Express 2014 Annual Report Download - page 120
Download and view the complete annual report
Please find page 120 of the 2014 American Express annual report below. You can navigate through the pages in the report by either clicking on the pages listed below, or by using the keyword search tool below to find specific information within the annual report.-
 1
1 -
2
-
3
-
4
-
5
-
6
-
7
-
8
-
9
-
10
-
11
-
12
-
13
-
14
-
15
-
16
-
17
-
18
-
19
-
20
-
21
-
22
-
23
-
24
-
25
-
26
-
27
-
28
-
29
-
30
-
31
-
32
-
33
-
34
-
35
-
36
-
37
-
38
-
39
-
40
-
41
-
42
-
43
-
44
-
45
-
46
-
47
-
48
-
49
-
50
-
51
-
52
-
53
-
54
-
55
-
56
-
57
-
58
-
59
-
60
-
61
-
62
-
63
-
64
-
65
-
66
-
67
-
68
-
69
-
70
-
71
-
72
-
73
-
74
-
75
-
76
-
77
-
78
-
79
-
80
-
81
-
82
-
83
-
84
-
85
-
86
-
87
-
88
-
89
-
90
-
91
-
92
-
93
-
94
-
95
-
96
-
97
-
98
-
99
-
100
-
101
-
102
-
103
-
104
-
105
-
106
-
107
-
108
-
109
-
 110
110 -
 111
111 -
 112
112 -
 113
113 -
 114
114 -
 115
115 -
 116
116 -
 117
117 -
 118
118 -
 119
119 -
 120
120 -
 121
121 -
 122
122 -
 123
123 -
 124
124 -
 125
125 -
 126
126 -
 127
127 -
 128
128 -
 129
129 -
 130
130
 |
 |

AMERICAN EXPRESS COMPANY
NOTES TO CONSOLIDATED FINANCIAL STATEMENTS
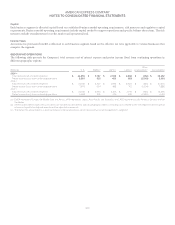
Capital
Each business segment is allocated capital based on established business model operating requirements, risk measures and regulatory capital
requirements. Business model operating requirements include capital needed to support operations and specific balance sheet items. The risk
measures include considerations for credit, market and operational risk.
Income Taxes
An income tax provision (benefit) is allocated to each business segment based on the effective tax rates applicable to various businesses that
comprise the segment.
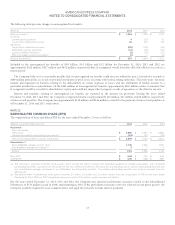
GEOGRAPHIC OPERATIONS
The following table presents the Company’s total revenues net of interest expense and pretax income (loss) from continuing operations in
different geographic regions:
(Millions) U.S. EMEA(a) JAPA(a) LACC(a)
Other
Unallocated(b) Consolidated
2014(c)
Total revenues net of interest expense $ 24,855 $ 3,767 $ 2,934 $ 2,888 $ (152) $ 34,292
Pretax income (loss) from continuing operations 8,869 525 463 683 (1,549) 8,991
2013(c)
Total revenues net of interest expense $ 23,745 $ 3,700 $ 2,952 $ 2,900 $ (323) $ 32,974
Pretax income (loss) from continuing operations 7,679 524 488 701 (1,504) 7,888
2012(c)
Total revenues net of interest expense $ 22,631 $ 3,594 $ 3,106 $ 2,774 $ (550) $ 31,555
Pretax income (loss) from continuing operations 6,468 505 426 605 (1,553) 6,451
(a) EMEA represents Europe, the Middle East and Africa; JAPA represents Japan, Asia/Pacific and Australia; and LACC represents Latin America, Canadaandthe
Caribbean.
(b) Other Unallocated includes net costs which are not directly allocable to specific geographic regions, including costs related to the net negative interest spread
on excess liquidity funding and executive office operations expenses.
(c) The data in the above table is, in part, based upon internal allocations, which necessarily involve management’s judgment.
120