American Express 2014 Annual Report Download - page 86
Download and view the complete annual report
Please find page 86 of the 2014 American Express annual report below. You can navigate through the pages in the report by either clicking on the pages listed below, or by using the keyword search tool below to find specific information within the annual report.-
 1
1 -
2
-
3
-
4
-
5
-
6
-
7
-
8
-
9
-
10
-
11
-
12
-
13
-
14
-
15
-
16
-
17
-
18
-
19
-
20
-
21
-
22
-
23
-
24
-
25
-
26
-
27
-
28
-
29
-
30
-
31
-
32
-
33
-
34
-
35
-
36
-
37
-
38
-
39
-
40
-
41
-
42
-
43
-
44
-
45
-
46
-
47
-
48
-
49
-
50
-
51
-
52
-
53
-
54
-
55
-
56
-
57
-
58
-
59
-
60
-
61
-
62
-
63
-
64
-
65
-
66
-
67
-
68
-
69
-
70
-
71
-
72
-
73
-
74
-
75
-
 76
76 -
 77
77 -
 78
78 -
 79
79 -
 80
80 -
 81
81 -
 82
82 -
 83
83 -
 84
84 -
 85
85 -
 86
86 -
 87
87 -
 88
88 -
 89
89 -
 90
90 -
 91
91 -
 92
92 -
 93
93 -
 94
94 -
 95
95 -
 96
96 -
97
-
98
-
99
-
100
-
101
-
102
-
103
-
104
-
105
-
106
-
107
-
108
-
109
-
110
-
111
-
112
-
113
-
114
-
115
-
116
-
117
-
118
-
119
-
120
-
121
-
122
-
123
-
124
-
125
-
126
-
127
-
128
-
129
-
130
 |
 |

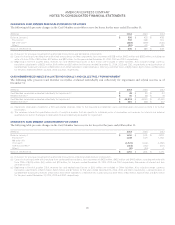
AMERICAN EXPRESS COMPANY
NOTES TO CONSOLIDATED FINANCIAL STATEMENTS
CARD MEMBER LOANS EVALUATED INDIVIDUALLY AND COLLECTIVELY FOR IMPAIRMENT
The following table presents Card Member loans evaluated individually and collectively for impairment and related reserves as of
December 31:
(Millions) 2014 2013 2012
Card Member loans evaluated individually for impairment(a) $286$356$ 633
Related reserves(a) $67$ 78 $ 153
Card Member loans evaluated collectively for impairment(b) $70,100$ 66,882 $ 64,596
Related reserves(b) $1,134$ 1,183 $ 1,318
(a) Represents loans modified in a TDR and related reserves. Refer to the Impaired Card Member Loans and Receivables discussion in Note 3 for further
information.
(b) Represents current loans and loans less than 90 days past due, loans over 90 days past due and accruing interest, and non-accrual loans. The reservesinclude
the quantitative results of analytical models that are specific to individual pools of loans and reserves for internal and external qualitative risk factorsthatapply
to loans that are collectively evaluated for impairment.
NOTE 5
INVESTMENT SECURITIES
Investment securities include debt and equity securities that the Company classifies as available-for-sale. The Company’s investment
securities, principally debt securities, are carried at fair value on the Consolidated Balance Sheets with unrealized gains (losses) recorded in
AOCI, net of income taxes. Realized gains and losses are recognized in results of operations upon disposition of the securities using the
specific identification method on a trade date basis. Refer to Note 15 for a description of the Company’s methodology for determining the
fair value of investment securities.
The following is a summary of investment securities as of December 31:
2014 2013 2012
Description of Securities
(Millions) Cost
Gross
Unrealized
Gains
Gross
Unrealized
Losses
Estimated
Fair
Value Cost
Gross
Unrealized
Gains
Gross
Unrealized
Losses
Estimated
Fair
Value
Estimated
Fair
Value
State and municipal obligations $ 3,366 $ 129 $ (2) $ 3,493 $ 4,060 $ 54 $ (79) $ 4,035 $ 4,474
U.S. Government agency obligations 3—— 3 3—— 3 3
U.S. Government treasury obligations 346 4 — 350 318 3 (1) 320 338
Corporate debt securities 37 3 — 40 43 3 — 46 79
Mortgage-backed securities(a) 128 8 — 136 160 5 (1) 164 224
Equity securities(b) —1—129 95 — 124 296
Foreign government bonds and
obligations 350 9 — 359 272 5 (1) 276 149
Other(c) 50 — (1) 49 50 — (2) 48 51
Total $ 4,280 $ 154 $ (3) $ 4,431 $ 4,935 $ 165 $ (84) $ 5,016 $ 5,614
(a) Represents mortgage-backed securities guaranteed by Fannie Mae, Freddie Mac or Ginnie Mae.
(b) Primarily represents the Company’s investment in the Industrial and Commercial Bank of China (ICBC) as of December 31, 2013 and 2012.
(c) Other comprises investments in various mutual funds.
The following table provides information about the Company’s investment securities with gross unrealized losses and the length of time that
individual securities have been in a continuous unrealized loss position as of December 31:
2014 2013
Less than 12 months 12 months or more Less than 12 months 12 months or more
Description of Securities
(Millions)
Estimated
Fair Value
Gross
Unrealized
Losses
Estimated
Fair Value
Gross
Unrealized
Losses
Estimated
Fair Value
Gross
Unrealized
Losses
Estimated
Fair Value
Gross
Unrealized
Losses
State and municipal obligations $—$—$72$(2)$ 1,320 $ (63) $ 106 $(16)
Foreign government bonds and obligations ————208 (1) — —
U.S. Government treasury obligations ————166 (1) — —
Mortgage-backed securities ————35 (1) — —
Other ——33(1)30 (1) 17 (1)
Total $—$—$105$(3)$ 1,759 $ (67) $ 123 $(17)
86