American Express 2014 Annual Report Download - page 47
Download and view the complete annual report
Please find page 47 of the 2014 American Express annual report below. You can navigate through the pages in the report by either clicking on the pages listed below, or by using the keyword search tool below to find specific information within the annual report.-
 1
1 -
2
-
3
-
4
-
5
-
6
-
7
-
8
-
9
-
10
-
11
-
12
-
13
-
14
-
15
-
16
-
17
-
18
-
19
-
20
-
21
-
22
-
23
-
24
-
25
-
26
-
27
-
28
-
29
-
30
-
31
-
32
-
33
-
34
-
35
-
36
-
 37
37 -
 38
38 -
 39
39 -
 40
40 -
 41
41 -
 42
42 -
 43
43 -
 44
44 -
 45
45 -
 46
46 -
 47
47 -
 48
48 -
 49
49 -
 50
50 -
 51
51 -
 52
52 -
 53
53 -
 54
54 -
 55
55 -
 56
56 -
 57
57 -
58
-
59
-
60
-
61
-
62
-
63
-
64
-
65
-
66
-
67
-
68
-
69
-
70
-
71
-
72
-
73
-
74
-
75
-
76
-
77
-
78
-
79
-
80
-
81
-
82
-
83
-
84
-
85
-
86
-
87
-
88
-
89
-
90
-
91
-
92
-
93
-
94
-
95
-
96
-
97
-
98
-
99
-
100
-
101
-
102
-
103
-
104
-
105
-
106
-
107
-
108
-
109
-
110
-
111
-
112
-
113
-
114
-
115
-
116
-
117
-
118
-
119
-
120
-
121
-
122
-
123
-
124
-
125
-
126
-
127
-
128
-
129
-
130
 |
 |

AMERICAN EXPRESS COMPANY
2014 FINANCIAL REVIEW
We had approximately $55.3 billion as of December 31, 2014 in U.S. credit card loans and charge card receivables that could be sold over
time through our existing securitization trusts, or pledged in return for secured borrowings to provide further liquidity, subject in each case
to applicable market conditions and eligibility criteria.
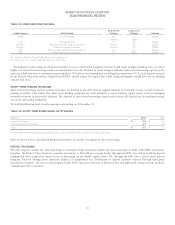
Committed Bank Credit Facilities
In addition to the secured borrowing facilities described earlier in this section, we maintained committed syndicated bank credit facilities as
of December 31, 2014 of $6.7 billion through facilities in the U.S. and Australia, which expire as follows:
TABLE 25: EXPIRATION OF COMMITTED SYNDICATED BANK CREDIT FACILITIES
(Billions)
2016 $2.0
2017 4.7
Total $6.7
The availability of the credit lines is subject to our compliance with certain financial covenants, principally the maintenance by American
Express Credit Corporation (Credco) of a certain ratio of combined earnings and fixed charges to fixed charges. As of December 31, 2014, we
were in compliance with each of our covenants. The drawn balance of the committed credit facilities of $3.7 billion as of December 31, 2014
was used to fund our business activities in the normal course. The remaining capacity of the facilities mainly served to further enhance our
contingent funding resources.
Our committed bank credit facilities do not contain material adverse change clauses, which might otherwise preclude borrowing under
the credit facilities, nor are they dependent on our credit rating.
CASH FLOWS
The following table summarizes our cash flow activity, followed by a discussion of the major drivers impacting operating, investing and
financing cash flows.
TABLE 26: CASH FLOWS
(Billions) 2014 2013 2012
Total cash provided by (used in):
Operating activities $ 11.0 $ 8.5 $ 7.1
Investing activities (8.0) (7.2) (6.5)
Financing activities —(3.9) (3.3)
Effect of exchange rates changes on cash and cash equivalents (0.2) (0.2) 0.1
Net increase (decrease) in cash and cash equivalents $2.8$ (2.8) $ (2.6)
Cash Flows from Operating Activities
Cash flows from operating activities primarily include net income adjusted for (i) non-cash items included in net income and (ii) changes in
the balances of operating assets and liabilities, which can vary significantly in the normal course of business due to the amount and timing of
various payments.
For the year ended December 31, 2014, net cash provided by operating activities was $11.0 billion as a result of net income of $5.9 billion
adjusted for non-cash items such as certain changes in provisions for losses, depreciation and amortization, stock-based compensation and
the pretax gain of $0.6 billion related to the GBT JV transaction. In addition, the pretax gain of $0.7 billion on the sale of our investment in
Concur is removed from operating activities since the proceeds of $1.0 billion are included as a cash inflow within investing activities. An
increase in accounts payable and other liabilities, which is a source of cash, was driven by higher discount business volumes and the
restructuring charge taken in the fourth quarter of the current year.
For the year ended December 31, 2013, net cash provided by operating activities was $8.5 billion as a result of net income of $5.4 billion
adjusted for non-cash items such as certain changes in provisions for losses, depreciation and amortization and stock-based compensation.
47