American Express 2014 Annual Report Download - page 122
Download and view the complete annual report
Please find page 122 of the 2014 American Express annual report below. You can navigate through the pages in the report by either clicking on the pages listed below, or by using the keyword search tool below to find specific information within the annual report.-
 1
1 -
2
-
3
-
4
-
5
-
6
-
7
-
8
-
9
-
10
-
11
-
12
-
13
-
14
-
15
-
16
-
17
-
18
-
19
-
20
-
21
-
22
-
23
-
24
-
25
-
26
-
27
-
28
-
29
-
30
-
31
-
32
-
33
-
34
-
35
-
36
-
37
-
38
-
39
-
40
-
41
-
42
-
43
-
44
-
45
-
46
-
47
-
48
-
49
-
50
-
51
-
52
-
53
-
54
-
55
-
56
-
57
-
58
-
59
-
60
-
61
-
62
-
63
-
64
-
65
-
66
-
67
-
68
-
69
-
70
-
71
-
72
-
73
-
74
-
75
-
76
-
77
-
78
-
79
-
80
-
81
-
82
-
83
-
84
-
85
-
86
-
87
-
88
-
89
-
90
-
91
-
92
-
93
-
94
-
95
-
96
-
97
-
98
-
99
-
100
-
101
-
102
-
103
-
104
-
105
-
106
-
107
-
108
-
109
-
110
-
111
-
 112
112 -
 113
113 -
 114
114 -
 115
115 -
 116
116 -
 117
117 -
 118
118 -
 119
119 -
 120
120 -
 121
121 -
 122
122 -
 123
123 -
 124
124 -
 125
125 -
 126
126 -
 127
127 -
 128
128 -
 129
129 -
 130
130
 |
 |

AMERICAN EXPRESS COMPANY
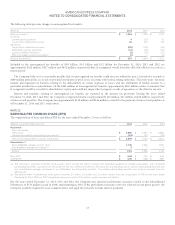
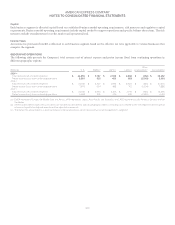
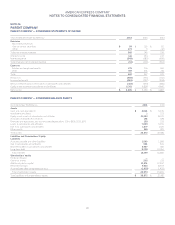
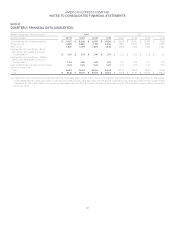
NOTES TO CONSOLIDATED FINANCIAL STATEMENTS
PARENT COMPANY — CONDENSED STATEMENTS OF CASH FLOWS
Years Ended December 31 (Millions) 2014 2013 2012
Cash Flows from Operating Activities
Net income $ 5,885 $ 5,359 $ 4,482
Adjustments to reconcile net income to cash provided by operating activities
Equity in net income of subsidiaries and affiliates (6,301) (5,838) (4,966)
Dividends received from subsidiaries and affiliates 5,455 4,768 3,355
Gain on sale of securities (99) (135) (121)
Other operating activities, primarily with subsidiaries and affiliates 173 324 196
Premium paid on debt exchange —— (541)
Net cash provided by operating activities 5,113 4,478 2,405
Cash Flows from Investing Activities
Sales of available-for-sale investment securities 111 157 118
Purchase of premises and equipment (39) (39) (38)
Loans to subsidiaries and affiliates (2,574) 1,498 (1,601)
Investments in subsidiaries and affiliates —— (11)
Net cash (used in) provided by investing activities (2,502) 1,616 (1,532)
Cash Flows from Financing Activities
(Principal payments on) / issuance of long-term debt (655) 843 —
Short-term debt of subsidiaries and affiliates 5,118 (1,497) 1,421
Issuance of American Express preferred shares 742 ——
Issuance of American Express common shares and other 362 721 443
Repurchase of American Express common shares (4,389) (3,943) (3,952)
Dividends paid (1,041) (939) (902)
Net cash provided by (used in) financing activities 137 (4,815) (2,990)
Net increase (decrease) in cash and cash equivalents 2,748 1,279 (2,117)
Cash and cash equivalents at beginning of year 6,076 4,797 6,914
Cash and cash equivalents at end of year $8,824$ 6,076 $ 4,797
Supplemental cash flow information
Non-cash financing activities
Charge related to impact of debt exchange on long-term debt $—$—$439
Gain on business travel joint venture transaction $630$—$ —
122