American Express 2014 Annual Report Download - page 97
Download and view the complete annual report
Please find page 97 of the 2014 American Express annual report below. You can navigate through the pages in the report by either clicking on the pages listed below, or by using the keyword search tool below to find specific information within the annual report.-
 1
1 -
2
-
3
-
4
-
5
-
6
-
7
-
8
-
9
-
10
-
11
-
12
-
13
-
14
-
15
-
16
-
17
-
18
-
19
-
20
-
21
-
22
-
23
-
24
-
25
-
26
-
27
-
28
-
29
-
30
-
31
-
32
-
33
-
34
-
35
-
36
-
37
-
38
-
39
-
40
-
41
-
42
-
43
-
44
-
45
-
46
-
47
-
48
-
49
-
50
-
51
-
52
-
53
-
54
-
55
-
56
-
57
-
58
-
59
-
60
-
61
-
62
-
63
-
64
-
65
-
66
-
67
-
68
-
69
-
70
-
71
-
72
-
73
-
74
-
75
-
76
-
77
-
78
-
79
-
80
-
81
-
82
-
83
-
84
-
85
-
86
-
 87
87 -
 88
88 -
 89
89 -
 90
90 -
 91
91 -
 92
92 -
 93
93 -
 94
94 -
 95
95 -
 96
96 -
 97
97 -
 98
98 -
 99
99 -
 100
100 -
 101
101 -
 102
102 -
 103
103 -
 104
104 -
 105
105 -
 106
106 -
 107
107 -
108
-
109
-
110
-
111
-
112
-
113
-
114
-
115
-
116
-
117
-
118
-
119
-
120
-
121
-
122
-
123
-
124
-
125
-
126
-
127
-
128
-
129
-
130
 |
 |

AMERICAN EXPRESS COMPANY
NOTES TO CONSOLIDATED FINANCIAL STATEMENTS
STOCK OPTIONS WITH PERFORMANCE-BASED AND MARKET-BASED CONDITIONS
On November 30, 2007 and January 31, 2008, the Company’s CEO was granted in the aggregate 2,750,000 of non-qualified stock option
awards with performance-based and market-based conditions. Both awards have a contractual term of 10 years and a vesting period of 6
years.
The aggregate grant date fair value of options with performance-based conditions was approximately $33.8 million. Compensation
expense for these awards was not recognized as the performance metrics were not achieved, and therefore, these stock options were forfeited.
No compensation expense for these awards was recorded in 2014, 2013 and 2012.
The aggregate grant date fair value of options with market-based conditions was approximately $10.5 million. Compensation expense for
these awards was recognized ratably over the vesting period. In January 2014, following the completion of the performance period, the
Compensation and Benefits Committee reviewed the Company’s performance and confirmed that the market-based condition was achieved,
resulting in a vesting of these stock options (687,000 out of 2,750,000 options became exercisable). No compensation expense for these
awards was recorded in 2014. Total compensation expense of approximately $0.3 million and $0.5 million was recorded in 2013 and 2012,
respectively.
RESTRICTED STOCK AWARDS
RSAs are valued based on the stock price on the date of grant and generally vest 25 percent per year beginning with the first anniversary of
the grant date or at 100 percent on the third anniversary of the grant date. RSA holders receive non-forfeitable dividends or dividend
equivalents. The total fair value of shares vested during 2014, 2013 and 2012 was $298 million, $336 million and $296 million, respectively
(based upon the Company’s stock price at the vesting date).
The weighted-average grant date fair value of RSAs granted in 2014, 2013 and 2012, is $86.65, $60.13 and $49.80, respectively.
LIABILITY-BASED AWARDS
Certain employees are awarded PGs and other incentive awards that can be settled with cash or equity shares at the Company’s discretion
and final Compensation and Benefits Committee payout approval. These awards earn value based on performance, market and service
conditions and vest over periods of one to three years.
PGs and other incentive awards are generally settled with cash and thus are classified as liabilities and, therefore, the fair value is
determined at the date of grant and remeasured quarterly as part of compensation expense over the vesting period. Cash paid upon vesting of
these awards in 2014, 2013 and 2012 was $62 million, $43 million and $66 million, respectively.
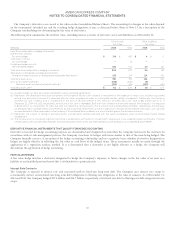
Summary of Stock Plan Expense
The components of the Company’s total stock-based compensation expense (net of forfeitures) for the years ended December 31 are as
follows:
(Millions) 2014 2013 2012
Restricted stock awards(a) $193$208$ 197
Stock options(a) 13 23 29
Liability-based awards 84 119 70
Performance/market-based stock options ——1
Total stock-based compensation expense(b) $290$350$ 297
(a) As of December 31, 2014, the total unrecognized compensation cost related to unvested RSAs and options of $211 million and $6 million, respectively, will be
recognized ratably over the weighted-average remaining vesting period of 1.3 years and 2.1 years, respectively.
(b) The total income tax benefit recognized in the Consolidated Statements of Income for stock-based compensation arrangements for the years ended
December 31, 2014, 2013 and 2012 was $104 million, $127 million and $107 million, respectively.
97