American Express 2014 Annual Report Download - page 96
Download and view the complete annual report
Please find page 96 of the 2014 American Express annual report below. You can navigate through the pages in the report by either clicking on the pages listed below, or by using the keyword search tool below to find specific information within the annual report.-
 1
1 -
2
-
3
-
4
-
5
-
6
-
7
-
8
-
9
-
10
-
11
-
12
-
13
-
14
-
15
-
16
-
17
-
18
-
19
-
20
-
21
-
22
-
23
-
24
-
25
-
26
-
27
-
28
-
29
-
30
-
31
-
32
-
33
-
34
-
35
-
36
-
37
-
38
-
39
-
40
-
41
-
42
-
43
-
44
-
45
-
46
-
47
-
48
-
49
-
50
-
51
-
52
-
53
-
54
-
55
-
56
-
57
-
58
-
59
-
60
-
61
-
62
-
63
-
64
-
65
-
66
-
67
-
68
-
69
-
70
-
71
-
72
-
73
-
74
-
75
-
76
-
77
-
78
-
79
-
80
-
81
-
82
-
83
-
84
-
85
-
 86
86 -
 87
87 -
 88
88 -
 89
89 -
 90
90 -
 91
91 -
 92
92 -
 93
93 -
 94
94 -
 95
95 -
 96
96 -
 97
97 -
 98
98 -
 99
99 -
 100
100 -
 101
101 -
 102
102 -
 103
103 -
 104
104 -
 105
105 -
 106
106 -
107
-
108
-
109
-
110
-
111
-
112
-
113
-
114
-
115
-
116
-
117
-
118
-
119
-
120
-
121
-
122
-
123
-
124
-
125
-
126
-
127
-
128
-
129
-
130
 |
 |

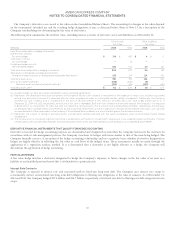
AMERICAN EXPRESS COMPANY
NOTES TO CONSOLIDATED FINANCIAL STATEMENTS
A summary of stock option and RSA activity as of December 31, 2014, and changes during the year is presented below:
Stock Options RSAs
(Shares in thousands) Shares
Weighted-
Average Exercise
Price Shares
Weighted-
Average Grant
Price
Outstanding as of December 31, 2013 18,615 $ 44.98 9,578 $ 51.88
Granted 295 86.64 2,639 86.65
Exercised/vested (5,893) 48.05 (3,427) 47.25
Forfeited (242) 51.83 (916) 60.98
Expired (46) 47.84 — —
Outstanding as of December 31, 2014 12,729 44.39 7,874 $ 64.48
Options vested and expected to vest as of December 31, 2014 12,726 44.39 — —
Options exercisable as of December 31, 2014 11,628 $ 42.64 — —
TheCompanyrecognizesthecostofemployeestockawardsgrantedinexchange for employee services based on the grant-date fair value of
the award, net of expected forfeitures. Those costs are recognized ratably over the vesting period.
STOCK OPTIONS
Each stock option has an exercise price equal to the market price of the Company’s common stock on the date of grant and a contractual
term of 10 years from the date of grant. Stock options generally vest 25 percent per year beginning with the first anniversary of the grant
date or at 100 percent on the third anniversary of the grant date.
Theweighted-averageremainingcontractuallifeandtheaggregateintrinsicvalue(theamountbywhichthefairvalueoftheCompany’s
stock exceeds the exercise price of the option) of the stock options outstanding, exercisable, and vested and expected to vest as of
December 31, 2014 are as follows:
Outstanding Exercisable
Vested and
Expected to Vest
Weighted-average remaining contractual life (in years) 3.8 3.5 3.8
Aggregate intrinsic value (millions) $ 619 $ 586 $ 619
The intrinsic value for options exercised during 2014, 2013 and 2012 was $245 million, $374 million and $209 million, respectively (based
upon the fair value of the Company’s stock price at the date of exercise). Cash received from the exercise of stock options in 2014, 2013 and
2012 was $283 million, $580 million and $368 million, respectively. The tax benefit realized from income tax deductions from stock option
exercises, which was recorded in additional paid-in capital, in 2014, 2013 and 2012 was $54 million, $84 million and $45 million, respectively.
The fair value of each option is estimated on the date of grant using a Black-Scholes-Merton option-pricing model. The following weighted-
average assumptions were used for grants issued in 2014, 2013 and 2012, the majority of which were granted in the beginning of each year:
2014 2013 2012
Dividend yield 1.1% 1.4% 1.5%
Expected volatility(a) 46% 39% 41%
Risk-free interest rate 2.2% 1.3% 1.3%
Expected life of stock option (in years)(b) 6.7 6.3 6.3
Weighted-average fair value per option $32.36$ 21.11 $ 17.48
(a) The expected volatility is based on both weighted historical and implied volatilities of the Company’s common stock price.
(b) In 2014, 2013 and 2012, the expected life of stock options was determined using both historical data and expectations of option exercise behavior.
96