American Express 2014 Annual Report Download - page 119
Download and view the complete annual report
Please find page 119 of the 2014 American Express annual report below. You can navigate through the pages in the report by either clicking on the pages listed below, or by using the keyword search tool below to find specific information within the annual report.-
 1
1 -
2
-
3
-
4
-
5
-
6
-
7
-
8
-
9
-
10
-
11
-
12
-
13
-
14
-
15
-
16
-
17
-
18
-
19
-
20
-
21
-
22
-
23
-
24
-
25
-
26
-
27
-
28
-
29
-
30
-
31
-
32
-
33
-
34
-
35
-
36
-
37
-
38
-
39
-
40
-
41
-
42
-
43
-
44
-
45
-
46
-
47
-
48
-
49
-
50
-
51
-
52
-
53
-
54
-
55
-
56
-
57
-
58
-
59
-
60
-
61
-
62
-
63
-
64
-
65
-
66
-
67
-
68
-
69
-
70
-
71
-
72
-
73
-
74
-
75
-
76
-
77
-
78
-
79
-
80
-
81
-
82
-
83
-
84
-
85
-
86
-
87
-
88
-
89
-
90
-
91
-
92
-
93
-
94
-
95
-
96
-
97
-
98
-
99
-
100
-
101
-
102
-
103
-
104
-
105
-
106
-
107
-
108
-
 109
109 -
 110
110 -
 111
111 -
 112
112 -
 113
113 -
 114
114 -
 115
115 -
 116
116 -
 117
117 -
 118
118 -
 119
119 -
 120
120 -
 121
121 -
 122
122 -
 123
123 -
 124
124 -
 125
125 -
 126
126 -
 127
127 -
 128
128 -
 129
129 -
130
 |
 |

AMERICAN EXPRESS COMPANY
NOTES TO CONSOLIDATED FINANCIAL STATEMENTS
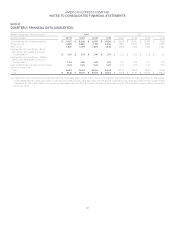
The following table presents certain selected financial information as of or for the years ended December 31, 2014, 2013 and 2012:
(Millions, except where indicated) USCS ICS GCS GNMS
Corporate &
Other(a) Consolidated
2014
Non-interest revenues $ 12,732 $ 4,737 $ 5,173 $ 5,426 $ 752 $ 28,820
Interest income 5,786 1,085 15 52 241 7,179
Interest expense 604 330 240 (269) 802 1,707
Total revenues net of interest expense 17,914 5,492 4,948 5,747 191 34,292
Total provision 1,396 370 180 93 5 2,044
Pretax income (loss) from continuing operations 5,100 449 2,408 2,620 (1,586) 8,991
Income tax provision (benefit) 1,900 38 865 960 (657) 3,106
Net income (loss) 3,200 411 1,543 1,660 (929) 5,885
Total equity (billions) 10.4 3.0 3.8 2.0 1.5 20.7
2013
Non-interest revenues 12,123 4,644 5,085 5,229 846 27,927
Interest income 5,565 1,118 13 32 277 7,005
Interest expense 693 361 245 (252) 911 1,958
Total revenues net of interest expense 16,995 5,401 4,853 5,513 212 32,974
Total provision 1,250 388 129 67 (2) 1,832
Pretax income (loss) from continuing operations 4,994 643 1,244 2,469 (1,462) 7,888
Income tax provision (benefit) 1,801 12 384 894 (562) 2,529
Net income (loss) 3,193 631 860 1,575 (900) 5,359
Total equity (billions) 9.3 3.1 3.7 2.0 1.4 19.5
2012
Non-interest revenues 11,469 4,561 4,995 5,005 897 26,927
Interest income 5,342 1,147 11 23 331 6,854
Interest expense 765 402 257 (243) 1,045 2,226
Total revenues net of interest expense 16,046 5,306 4,749 5,271 183 31,555
Total provision 1,253 279 106 73 1 1,712
Pretax income (loss) from continuing operations 4,069 659 960 2,219 (1,456) 6,451
Income tax provision (benefit) 1,477 25 316 776 (625) 1,969
Net income (loss) 2,592 634 644 1,443 (831) 4,482
Total equity (billions) $ 8.7 $ 2.9 $ 3.6 $ 2.0 $ 1.7 $ 18.9
(a) Corporate & Other includes adjustments and eliminations for intersegment activity.
Total Revenues Net of Interest Expense
The Company allocates discount revenue and certain other revenues among segments using a transfer pricing methodology. Within the
USCS, ICS and GCS segments, discount revenue reflects the issuer component of the overall discount revenue generated by each segment’s
Card Members; within the GNMS segment, discount revenue reflects the network and acquirer component of the overall discount revenue.
Net card fees and travel commissions and fees are directly attributable to the segment in which they are reported.
Interest and fees on loans and certain investment income is directly attributable to the segment in which it is reported. Interest expense
represents an allocated funding cost based on a combination of segment funding requirements and internal funding rates.
Provisions for Losses
The provisions for losses are directly attributable to the segment in which they are reported.
Expenses
Marketing and promotion expenses are included in each segment based on actual expenses incurred, with the exception of brand advertising,
which is primarily reflected in the GNMS and USCS segments. Rewards and Card Member services expenses are included in each segment
based on actual expenses incurred within each segment.
Salaries and employee benefits and other operating expenses include expenses such as professional services, occupancy and equipment
and communications incurred directly within each segment. In addition, expenses related to the Company’s support services, such as
technology costs, are allocated to each segment primarily based on support service activities directly attributable to the segment. Other
overhead expenses, such as staff group support functions, are allocated from Corporate & Other to the other segments based on a mix of each
segment’s direct consumption of services and relative level of pretax income.
119