American Express 2014 Annual Report Download - page 121
Download and view the complete annual report
Please find page 121 of the 2014 American Express annual report below. You can navigate through the pages in the report by either clicking on the pages listed below, or by using the keyword search tool below to find specific information within the annual report.-
 1
1 -
2
-
3
-
4
-
5
-
6
-
7
-
8
-
9
-
10
-
11
-
12
-
13
-
14
-
15
-
16
-
17
-
18
-
19
-
20
-
21
-
22
-
23
-
24
-
25
-
26
-
27
-
28
-
29
-
30
-
31
-
32
-
33
-
34
-
35
-
36
-
37
-
38
-
39
-
40
-
41
-
42
-
43
-
44
-
45
-
46
-
47
-
48
-
49
-
50
-
51
-
52
-
53
-
54
-
55
-
56
-
57
-
58
-
59
-
60
-
61
-
62
-
63
-
64
-
65
-
66
-
67
-
68
-
69
-
70
-
71
-
72
-
73
-
74
-
75
-
76
-
77
-
78
-
79
-
80
-
81
-
82
-
83
-
84
-
85
-
86
-
87
-
88
-
89
-
90
-
91
-
92
-
93
-
94
-
95
-
96
-
97
-
98
-
99
-
100
-
101
-
102
-
103
-
104
-
105
-
106
-
107
-
108
-
109
-
110
-
 111
111 -
 112
112 -
 113
113 -
 114
114 -
 115
115 -
 116
116 -
 117
117 -
 118
118 -
 119
119 -
 120
120 -
 121
121 -
 122
122 -
 123
123 -
 124
124 -
 125
125 -
 126
126 -
 127
127 -
 128
128 -
 129
129 -
 130
130
 |
 |

AMERICAN EXPRESS COMPANY
NOTES TO CONSOLIDATED FINANCIAL STATEMENTS
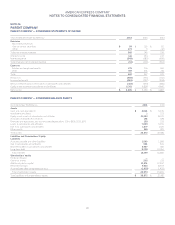
NOTE 26
PARENT COMPANY
PARENT COMPANY — CONDENSED STATEMENTS OF INCOME
Years Ended December 31 (Millions) 2014 2013 2012
Revenues
Non-interest revenues
Gain on sale of securities $99$135$ 121
Other 270 5(12)
Total non-interest revenues 369 140 109
Interest income 141 134 137
Interest expense (543) (583) (609)
Total revenues net of interest expense (33) (309) (363)
Expenses
Salaries and employee benefits 275 206 165
Other 357 261 214
Total 632 467 379
Pretax loss (665) (776) (742)
Income tax benefit (249) (297) (258)
Net loss before equity in net income of subsidiaries and affiliates (416) (479) (484)
Equity in net income of subsidiaries and affiliates 6,301 5,838 4,966
Net income $ 5,885 $ 5,359 $ 4,482
PARENT COMPANY — CONDENSED BALANCE SHEETS
As of December 31 (Millions) 2014 2013
Assets
Cash and cash equivalents $8,824$6,076
Investment securities 1123
Equity in net assets of subsidiaries and affiliates 20,123 19,571
Accounts receivable, less reserves 134 378
Premises and equipment, less accumulated depreciation: 2014, $106; 2013, $76 139 136
Loans to subsidiaries and affiliates 7,809 5,236
Due from subsidiaries and affiliates 1,477 1,126
Other assets 365 335
Total assets 38,872 32,981
Liabilities and Shareholders’ Equity
Liabilities
Accounts payable and other liabilities 1,590 1,386
Due to subsidiaries and affiliates 964 926
Short-term debt of subsidiaries and affiliates 5,937 819
Long-term debt 9,708 10,354
Total liabilities 18,199 13,485
Shareholders’ equity
Preferred Shares ——
Common shares 205 213
Additional paid-in capital 12,874 12,202
Retained earnings 9,513 8,507
Accumulated other comprehensive loss (1,919) (1,426)
Total shareholders’ equity 20,673 19,496
Total liabilities and shareholders’ equity $ 38,872 $32,981
121