American Express 2014 Annual Report Download - page 87
Download and view the complete annual report
Please find page 87 of the 2014 American Express annual report below. You can navigate through the pages in the report by either clicking on the pages listed below, or by using the keyword search tool below to find specific information within the annual report.-
 1
1 -
2
-
3
-
4
-
5
-
6
-
7
-
8
-
9
-
10
-
11
-
12
-
13
-
14
-
15
-
16
-
17
-
18
-
19
-
20
-
21
-
22
-
23
-
24
-
25
-
26
-
27
-
28
-
29
-
30
-
31
-
32
-
33
-
34
-
35
-
36
-
37
-
38
-
39
-
40
-
41
-
42
-
43
-
44
-
45
-
46
-
47
-
48
-
49
-
50
-
51
-
52
-
53
-
54
-
55
-
56
-
57
-
58
-
59
-
60
-
61
-
62
-
63
-
64
-
65
-
66
-
67
-
68
-
69
-
70
-
71
-
72
-
73
-
74
-
75
-
76
-
 77
77 -
 78
78 -
 79
79 -
 80
80 -
 81
81 -
 82
82 -
 83
83 -
 84
84 -
 85
85 -
 86
86 -
 87
87 -
 88
88 -
 89
89 -
 90
90 -
 91
91 -
 92
92 -
 93
93 -
 94
94 -
 95
95 -
 96
96 -
 97
97 -
98
-
99
-
100
-
101
-
102
-
103
-
104
-
105
-
106
-
107
-
108
-
109
-
110
-
111
-
112
-
113
-
114
-
115
-
116
-
117
-
118
-
119
-
120
-
121
-
122
-
123
-
124
-
125
-
126
-
127
-
128
-
129
-
130
 |
 |

AMERICAN EXPRESS COMPANY
NOTES TO CONSOLIDATED FINANCIAL STATEMENTS
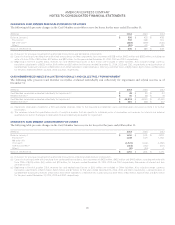
The following table summarizes the gross unrealized losses due to temporary impairments by ratio of fair value to amortized cost as of
December 31:
Less than 12 months 12 months or more Total
Ratio of Fair Value to Amortized Cost
(Dollars in millions)
Number of
Securities
Estimated
Fair Value
Gross
Unrealized
Losses
Number of
Securities
Estimated
Fair Value
Gross
Unrealized
Losses
Number of
Securities
Estimated
Fair Value
Gross
Unrealized
Losses
2014:
90%–100% —$ —$ — 15$ 105$ (3) 15$ 105$ (3)
Total as of December 31, 2014 —$ —$ — 15$ 105$ (3) 15$ 105$ (3)
2013:
90%–100% 228 $ 1,665 $ (53) 6 $ 24 $ (2) 234 $ 1,689 $ (55)
Less than 90% 13 94 (14) 5 99 (15) 18 193 (29)
Total as of December 31, 2013 241 $ 1,759 $ (67) 11 $ 123 $ (17) 252 $ 1,882 $ (84)
The gross unrealized losses are attributed to overall wider credit spreads for state and municipal securities, wider credit spreads for specific
issuers, adverse changes in market benchmark interest rates, or a combination thereof, all as compared to those prevailing when the
investment securities were acquired.
Overall, for the investment securities in gross unrealized loss positions identified above, (i) the Company does not intend to sell the
investment securities, (ii) it is more likely than not that the Company will not be required to sell the investment securities before recovery of
the unrealized losses, and (iii) the Company expects that the contractual principal and interest will be received on the investment securities.
As a result, the Company recognized no other-than-temporary impairment during the periods presented.
SUPPLEMENTAL INFORMATION
Contractual maturities and weighted average yields for investment securities, excluding equity securities and other securities, as of
December 31, 2014 were as follows:
(Millions)
Due within 1
year
Due after 1
year but
within 5 years
Due after 5
years but
within 10 years
Due after 10
years Total
State and municipal obligations(a) $ 182 $ 74 $ 233 $ 3,004 $ 3,493
U.S. Government agency obligations ——— 3 3
U.S. Government treasury obligations 66 264 8 12 350
Corporate debt securities 634 — — 40
Mortgage-backed securities(a) —2—134136
Foreign government bonds and obligations 307 7 — 45 359
Total Estimated Fair Value $561$381$241$3,198 4,381
Total Cost $ 560 $ 374 $ 225 $ 3,071 4,230
Weighted average yields(b)(c) 2.50% 2.07% 6.71% 6.81%
(a) The expected payments on state and municipal obligations and mortgage-backed securities may not coincide with their contractual maturities because the
issuers have the right to call or prepay certain obligations.
(b) Average yields for investment securities have been calculated using the effective yield on the date of purchase.
(c) Yields on tax-exempt investment securities have been computed on a tax-equivalent basis using the U.S. federal statutory tax rate of 35 percent.
87