American Express 2014 Annual Report Download - page 24
Download and view the complete annual report
Please find page 24 of the 2014 American Express annual report below. You can navigate through the pages in the report by either clicking on the pages listed below, or by using the keyword search tool below to find specific information within the annual report.-
 1
1 -
2
-
3
-
4
-
5
-
6
-
7
-
8
-
9
-
10
-
11
-
12
-
13
-
 14
14 -
 15
15 -
 16
16 -
 17
17 -
 18
18 -
 19
19 -
 20
20 -
 21
21 -
 22
22 -
 23
23 -
 24
24 -
 25
25 -
 26
26 -
 27
27 -
 28
28 -
 29
29 -
 30
30 -
 31
31 -
 32
32 -
 33
33 -
 34
34 -
35
-
36
-
37
-
38
-
39
-
40
-
41
-
42
-
43
-
44
-
45
-
46
-
47
-
48
-
49
-
50
-
51
-
52
-
53
-
54
-
55
-
56
-
57
-
58
-
59
-
60
-
61
-
62
-
63
-
64
-
65
-
66
-
67
-
68
-
69
-
70
-
71
-
72
-
73
-
74
-
75
-
76
-
77
-
78
-
79
-
80
-
81
-
82
-
83
-
84
-
85
-
86
-
87
-
88
-
89
-
90
-
91
-
92
-
93
-
94
-
95
-
96
-
97
-
98
-
99
-
100
-
101
-
102
-
103
-
104
-
105
-
106
-
107
-
108
-
109
-
110
-
111
-
112
-
113
-
114
-
115
-
116
-
117
-
118
-
119
-
120
-
121
-
122
-
123
-
124
-
125
-
126
-
127
-
128
-
129
-
130
 |
 |

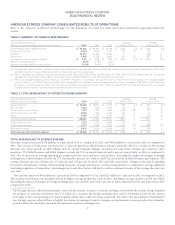
AMERICAN EXPRESS COMPANY
2014 FINANCIAL REVIEW
TABLE 5: EXPENSES SUMMARY
Years Ended December 31,
(Millions, except percentages) 2014 2013 2012
Change
2014 vs. 2013
Change
2013 vs. 2012
Marketing and promotion $3,320$ 3,043 $ 2,890 $ 277 9 % $ 153 5 %
Card Member rewards 6,931 6,457 6,282 474 7 175 3
Card Member services and other 822 767 772 55 7 (5) (1)
Total marketing, promotion, rewards and Card Member services
and other 11,073 10,267 9,944 806 8 323 3
Salaries and employee benefits 6,095 6,191 6,597 (96) (2) (406) (6)
Other, net 6,089 6,796 6,851 (707) (10) (55) (1)
Total expenses $ 23,257 $ 23,254 $ 23,392 $ 3 — % $ (138) (1) %
EXPENSES
Marketing and promotion expenses increased $277 million or 9 percent in 2014 as compared to 2013, and $153 million or 5 percent in 2013
as compared to 2012. The increase in 2014 as compared to 2013 was primarily driven by the reinvestment of a portion of the gains from the
business travel joint venture transaction and the sale of our investment in Concur in growth initiatives. The 2013 increase as compared to
2012 was driven by higher spend on Card Member acquisition marketing.
Card Member rewards expenses increased $474 million or 7 percent in 2014 as compared to 2013, and $175 million or 3 percent in 2013
as compared to 2012. The increase in 2014 as compared to 2013 was primarily due to higher Membership Rewards expense of $263 million,
driven by a $266 million increase related to new points earned, in line with higher spending volumes, and a higher weighted average cost
(WAC) per point assumption, including the impact of the $109 million charge related to the Delta partnership renewal in the fourth quarter
of 2014; these increases were offset by slower average growth in the Ultimate Redemption Rate (URR). Co-brand rewards expense increased
$211 million, primarily driven by higher spending volumes.
The 2013 increase in Card Member rewards expenses was driven by higher co-brand rewards expenses of $283 million, primarily relating
to higher spending volumes, partially offset by a decrease in Membership Rewards expenses of $108 million. The decrease in Membership
Rewards expenses was primarily driven by a $208 million decrease related to the liability for points earned but not yet redeemed, including
the impact of a 2012 charge related to enhancements made to the U.S. URR estimation process of $342 million, partially offset by a net
increase in expenses related to slower average declines in the WAC per point assumption and slower average growth in the URR as compared
to 2012. The $208 million decrease was partially offset by an increase in expense related to new points earned of $100 million.
The Membership Rewards URR for current program participants was 95 percent (rounded up) at December 31, 2014, an increase from 94
percent (rounded down) at December 31, 2013 and 94 percent (rounded up) at December 31, 2012. The increases in the URR were driven by
greater engagement in our Membership Rewards program.
Card Member services expenses increased $55 million or 7 percent in 2014 compared to 2013 and decreased $5 million or 1 percent in
2013 as compared to 2012. The increase in 2014 as compared to 2013 was primarily driven by increased engagement levels and use of certain
Card Member benefits, as well as recently opened American Express-branded airport lounges.
Salaries and employee benefits expenses decreased $96 million or 2 percent in 2014 as compared to 2013, and $406 million or 6 percent in
2013 as compared to 2012. The decrease in 2014 as compared to 2013 was primarily due to the business travel joint venture transaction,
resulting in a lack of comparability between periods. This decrease was partially offset by restructuring charges in the second and fourth
quarters of 2014. The decrease in 2013 as compared to 2012 was primarily driven by a restructuring charge in the fourth quarter of 2012.
Other expenses decreased $707 million or 10 percent in 2014 as compared to 2013, and $55 million or 1 percent in 2013 as compared to
2012. The decrease in 2014 as compared to 2013 was primarily driven by the business travel joint venture transaction, which resulted in a
gain in the second quarter of 2014 and a lack of comparability between periods beginning in the third quarter of 2014, and the proposed
merchant litigation settlement in 2013. The decrease was also due to lower professional services and occupancy and equipment expenses in
2014. These benefits were partially offset by higher fraud expense and non-income tax items in 2014, as well as the American Express
Foundation contribution in the second quarter of 2014. The 2013 decrease was driven by higher Card Member reimbursements and
investment impairments in 2012, partially offset by higher professional services expenses, driven by increased investments in technology
development and other investments in the business, as well as higher occupancy and equipment expenses, primarily driven by higher data
processing expenses as well as the proposed merchant litigation settlement in the fourth quarter of 2013.
24