American Express 2014 Annual Report Download - page 32
Download and view the complete annual report
Please find page 32 of the 2014 American Express annual report below. You can navigate through the pages in the report by either clicking on the pages listed below, or by using the keyword search tool below to find specific information within the annual report.-
 1
1 -
2
-
3
-
4
-
5
-
6
-
7
-
8
-
9
-
10
-
11
-
12
-
13
-
14
-
15
-
16
-
17
-
18
-
19
-
20
-
21
-
 22
22 -
 23
23 -
 24
24 -
 25
25 -
 26
26 -
 27
27 -
 28
28 -
 29
29 -
 30
30 -
 31
31 -
 32
32 -
 33
33 -
 34
34 -
 35
35 -
 36
36 -
 37
37 -
 38
38 -
 39
39 -
 40
40 -
 41
41 -
 42
42 -
43
-
44
-
45
-
46
-
47
-
48
-
49
-
50
-
51
-
52
-
53
-
54
-
55
-
56
-
57
-
58
-
59
-
60
-
61
-
62
-
63
-
64
-
65
-
66
-
67
-
68
-
69
-
70
-
71
-
72
-
73
-
74
-
75
-
76
-
77
-
78
-
79
-
80
-
81
-
82
-
83
-
84
-
85
-
86
-
87
-
88
-
89
-
90
-
91
-
92
-
93
-
94
-
95
-
96
-
97
-
98
-
99
-
100
-
101
-
102
-
103
-
104
-
105
-
106
-
107
-
108
-
109
-
110
-
111
-
112
-
113
-
114
-
115
-
116
-
117
-
118
-
119
-
120
-
121
-
122
-
123
-
124
-
125
-
126
-
127
-
128
-
129
-
130
 |
 |

AMERICAN EXPRESS COMPANY
2014 FINANCIAL REVIEW
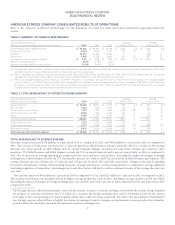
INTERNATIONAL CARD SERVICES SEGMENT
TABLE 12: ICS SELECTED INCOME STATEMENT DATA
Years Ended December 31,
(Millions, except percentages) 2014 2013 2012
Change
2014 vs. 2013
Change
2013 vs. 2012
Revenues
Discount revenue, net card fees and other $4,737$ 4,644 $ 4,561 $ 93 2 % $ 83 2 %
Interest income 1,085 1,118 1,147 (33) (3) (29) (3)
Interest expense 330 361 402 (31) (9) (41) (10)
Net interest income 755 757 745 (2) — 12 2
Total revenues net of interest expense 5,492 5,401 5,306 91 2 95 2
Provisions for losses 370 388 279 (18) (5) 109 39
Total revenues net of interest expense after provisions for losses 5,122 5,013 5,027 109 2 (14) —
Expenses
Marketing, promotion, rewards, Card Member services and
other 2,160 2,013 1,927 147 7 86 4
Salaries and employee benefits and other operating expenses 2,513 2,357 2,441 156 7 (84) (3)
Total expenses 4,673 4,370 4,368 303 7 2 —
Pretax segment income 449 643 659 (194) (30) (16) (2)
Income tax provision 38 12 25 26 # (13) (52)
Segment income $411$ 631 $ 634 $ (220) (35) % $ (3) — %
Effective tax rate 8.5% 1.9% 3.8%
# Denotes a variance greater than 100 percent
ICS issues proprietary consumer and small business cards outside the U.S. and operates a coalition loyalty business in various countries.
TOTAL REVENUES NET OF INTEREST EXPENSE
Discount revenue, net card fees and other revenues increased $93 million or 2 percent in 2014 as compared to 2013, and increased 6 percent
excluding the impact of foreign exchange rates.2The increase was primarily driven by higher Loyalty Partner-related fees, higher discount
revenue and an increase in net card fees. Billed business increased 2 percent in 2014 as compared to 2013, and 6 percent excluding the impact
of foreign exchange rates. Refer to Table 7 for additional information on billed business by region.
Interest income decreased $33 million or 3 percent in 2014 as compared to 2013, and increased 2 percent excluding the impact of foreign
exchange rates.2
Interest expense decreased $31 million or 9 percent in 2014 as compared to 2013, and decreased 2 percent excluding the impact of foreign
exchange rates,2primarily due to lower funding costs.
Total revenues net of interest expense increased $95 million or 2 percent in 2013 as compared to 2012, primarily driven by higher net card
fees, Loyalty Partner-related fees and foreign exchange conversion fee revenue.
PROVISIONS FOR LOSSES
Provisions for losses decreased $18 million or 5 percent in 2014, as compared to 2013, and decreased 1 percent excluding the impact of
foreign exchange rates,2primarily driven by a lower provision for charge cards.
Provisions for losses increased $109 million or 39 percent in 2013 as compared to 2012, primarily driven by a higher provision for both
charge cards and Card Member loans. The increase in charge card provision was driven by higher average receivables resulting in higher net
write-offs and a reserve build in 2013. The increase in Card Member loans provision was driven by a lower reserve release compared to 2012,
partially offset by lower net write-offs.
Refer to Table 13 for the lending and charge write-off rates for 2014, 2013 and 2012.
2Refer to footnote 1 on page 22 relating to changes in foreign exchange rate.
32