American Express 2014 Annual Report Download - page 31
Download and view the complete annual report
Please find page 31 of the 2014 American Express annual report below. You can navigate through the pages in the report by either clicking on the pages listed below, or by using the keyword search tool below to find specific information within the annual report.-
 1
1 -
2
-
3
-
4
-
5
-
6
-
7
-
8
-
9
-
10
-
11
-
12
-
13
-
14
-
15
-
16
-
17
-
18
-
19
-
20
-
 21
21 -
 22
22 -
 23
23 -
 24
24 -
 25
25 -
 26
26 -
 27
27 -
 28
28 -
 29
29 -
 30
30 -
 31
31 -
 32
32 -
 33
33 -
 34
34 -
 35
35 -
 36
36 -
 37
37 -
 38
38 -
 39
39 -
 40
40 -
 41
41 -
42
-
43
-
44
-
45
-
46
-
47
-
48
-
49
-
50
-
51
-
52
-
53
-
54
-
55
-
56
-
57
-
58
-
59
-
60
-
61
-
62
-
63
-
64
-
65
-
66
-
67
-
68
-
69
-
70
-
71
-
72
-
73
-
74
-
75
-
76
-
77
-
78
-
79
-
80
-
81
-
82
-
83
-
84
-
85
-
86
-
87
-
88
-
89
-
90
-
91
-
92
-
93
-
94
-
95
-
96
-
97
-
98
-
99
-
100
-
101
-
102
-
103
-
104
-
105
-
106
-
107
-
108
-
109
-
110
-
111
-
112
-
113
-
114
-
115
-
116
-
117
-
118
-
119
-
120
-
121
-
122
-
123
-
124
-
125
-
126
-
127
-
128
-
129
-
130
 |
 |

AMERICAN EXPRESS COMPANY
2014 FINANCIAL REVIEW
Total expenses increased $27 million in 2013 as compared to 2012 primarily driven by higher marketing and promotion expenses and
rewards costs. The increase in Card Member rewards was driven by higher co-brand rewards expenses, substantially offset by the impact of a
$317 million expense in 2012 related to enhancements to the U.S. URR estimation process. These increases were largely offset by lower Card
Member reimbursement costs in 2013 and the impact of the restructuring charge in the fourth quarter of 2012.
INCOME TAXES
The tax rate in all periods includes the benefits from the resolution of certain prior years’ tax items and the relationship of recurring
permanent tax benefits to varying levels of pretax income.
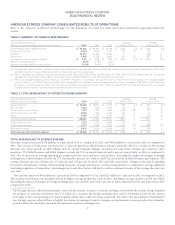
TABLE 11: USCS SELECTED STATISTICAL INFORMATION
As of or for the Years Ended December 31,
(Millions, except percentages and where indicated) 2014 2013 2012
Change
2014 vs. 2013
Change
2013 vs. 2012
Card billed business (billions) $542.0$ 501.0 $ 462.3 8 % 8 %
Total cards-in-force 45.6 43.7 42.2 4 4
Basic cards-in-force 34.0 32.5 31.3 5 4
Average basic Card Member spending (dollars)*$16,294$ 15,689 $ 14,986 4 5
U.S. Consumer Travel:
Travel sales $ 3,774 $ 3,967 $ 4,042 (5) (2)
Travel commissions and fees/sales 7.2 % 7.1 % 7.6 %
Total segment assets (billions) $ 113.2 $103.5$ 98.3 9 5
Segment capital $10,433$ 9,269 $ 8,714 13 6
Return on average segment capital(a) 32.5 % 35.6 % 28.8 %
Return on average tangible segment capital(a) 33.6 % 37.0 % 30.1 %
Card Member receivables:
Total receivables (billions) $ 22.5 $21.8$ 21.1 3 3
Net write-off rate – principal only(b) 1.6 % 1.7 % 1.9 %
Net write-off rate – principal and fees(b) 1.8 % 1.9 % 2.1 %
30 days past due as a % of total 1.7 % 1.6 % 1.8 %
Card Member loans:
Total loans (billions) $62.6$58.4$56.0 7% 4%
Net write-off rate – principal only(b) 1.5 % 1.8 % 2.1 %
Net write-off rate – principal, interest and fees(b) 1.7 % 2.0 % 2.3 %
30 days past due as a % of total 1.0 % 1.1 % 1.2 %
Calculation of Net Interest Yield on Card Member Loans:
Net interest income $5,182$ 4,872 $ 4,577
Exclude:
Interest expense not attributable to the Company’s
Card Member loan portfolio 157 183 204
Interest income not attributable to the Company’s
Card Member loan portfolio (12) (9) (9)
Adjusted net interest income(c) $5,327$ 5,046 $ 4,772
Average loans (billions) $57.8$54.7$52.8
Exclude certain non-traditional Card Member loans and other fees (billions) ———
Adjusted average loans (billions)(c) $57.8$54.7$52.8
Net interest income divided by average loans 9.0 % 8.9 % 8.7 %
Net interest yield on Card Member loans(c) 9.2 % 9.2 % 9.0 %
* Proprietary cards only.
(a) Return on average segment capital is calculated by dividing (i) one-year period segment income ($3.2 billion, $3.2 billion and $2.6 billion for 2014, 2013 and
2012, respectively) by (ii) one-year average segment capital ($9.8 billion for 2014, and $9.0 billion for both 2013 and 2012). Return on average tangible segment
capital, a non-GAAP measure, is computed in the same manner as return on average segment capital except the computation of average tangible segment
capital, a non-GAAP measure, excludes from average segment capital average goodwill and other intangibles of $319 million, $334 million and $379 million as of
December 31, 2014, 2013 and 2012, respectively. We believe return on average tangible segment capital is a useful measure of the profitability of our business.
(b) Refer to Table 8 footnote (e).
(c) Adjusted net interest income, adjusted average loans and net interest yield on Card Member loans are non-GAAP measures. Refer to “Glossary of Selected
Terminology” for the definitions of these terms. We believe adjusted net interest income and adjusted average loans are useful to investors because they are
components of net interest yield on Card Member loans, which provides a measure of profitability of our Card Member loan portfolio.
31