American Express 2014 Annual Report Download - page 30
Download and view the complete annual report
Please find page 30 of the 2014 American Express annual report below. You can navigate through the pages in the report by either clicking on the pages listed below, or by using the keyword search tool below to find specific information within the annual report.-
 1
1 -
2
-
3
-
4
-
5
-
6
-
7
-
8
-
9
-
10
-
11
-
12
-
13
-
14
-
15
-
16
-
17
-
18
-
19
-
 20
20 -
 21
21 -
 22
22 -
 23
23 -
 24
24 -
 25
25 -
 26
26 -
 27
27 -
 28
28 -
 29
29 -
 30
30 -
 31
31 -
 32
32 -
 33
33 -
 34
34 -
 35
35 -
 36
36 -
 37
37 -
 38
38 -
 39
39 -
 40
40 -
41
-
42
-
43
-
44
-
45
-
46
-
47
-
48
-
49
-
50
-
51
-
52
-
53
-
54
-
55
-
56
-
57
-
58
-
59
-
60
-
61
-
62
-
63
-
64
-
65
-
66
-
67
-
68
-
69
-
70
-
71
-
72
-
73
-
74
-
75
-
76
-
77
-
78
-
79
-
80
-
81
-
82
-
83
-
84
-
85
-
86
-
87
-
88
-
89
-
90
-
91
-
92
-
93
-
94
-
95
-
96
-
97
-
98
-
99
-
100
-
101
-
102
-
103
-
104
-
105
-
106
-
107
-
108
-
109
-
110
-
111
-
112
-
113
-
114
-
115
-
116
-
117
-
118
-
119
-
120
-
121
-
122
-
123
-
124
-
125
-
126
-
127
-
128
-
129
-
130
 |
 |

AMERICAN EXPRESS COMPANY
2014 FINANCIAL REVIEW
U.S. CARD SERVICES SEGMENT
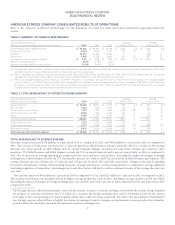
TABLE 10: USCS SELECTED INCOME STATEMENT DATA
Years Ended December 31,
(Millions, except percentages) 2014 2013 2012
Change
2014 vs. 2013
Change
2013 vs. 2012
Revenues
Discount revenue, net card fees and other $12,732 $ 12,123 $ 11,469 $ 609 5 % $ 654 6 %
Interest income 5,786 5,565 5,342 221 4 223 4
Interest expense 604 693 765 (89) (13) (72) (9)
Net interest income 5,182 4,872 4,577 310 6 295 6
Total revenues net of interest expense 17,914 16,995 16,046 919 5 949 6
Provisions for losses 1,396 1,250 1,253 146 12 (3) —
Total revenues net of interest expense after provisions for losses 16,518 15,745 14,793 773 5 952 6
Expenses
Marketing, promotion, rewards, Card Member services and other 7,301 6,825 6,552 476 7 273 4
Salaries and employee benefits and other operating expenses 4,117 3,926 4,172 191 5 (246) (6)
Total expenses 11,418 10,751 10,724 667 6 27 —
Pretax segment income 5,100 4,994 4,069 106 2 925 23
Income tax provision 1,900 1,801 1,477 99 5 324 22
Segment income $3,200 $ 3,193 $ 2,592 $ 7 — % $ 601 23 %
Effective tax rate 37.3% 36.1% 36.3%
USCS issues a wide range of card products and services to consumers and small businesses in the U.S., and provides consumer travel services
to Card Members and other consumers.
TOTAL REVENUES NET OF INTEREST EXPENSE
Discount revenue, net card fees and other revenues increased $609 million or 5 percent in 2014 as compared to 2013, primarily driven by
higher discount revenue, due to billed business growth, partially offset by a decrease in the average discount rate and higher cash rebate
rewards. Billed business increased 8 percent in 2014 as compared to 2013, primarily driven by a 4 percent increase in average spending per
proprietary basic card and 4 percent higher cards-in-force.
Interest income increased $221 million or 4 percent in 2014 as compared to 2013, primarily driven by higher average Card Member loans,
partially offset by higher Card Member reimbursements. Interest expense decreased $89 million or 13 percent in 2014 as compared to 2013,
due to lower funding costs.
Total revenues net of interest expense increased $949 million or 6 percent in 2013 as compared to 2012, primarily driven by higher
discount revenue, due to 8 percent growth in billed business and increased net interest income.
PROVISIONS FOR LOSSES
Provisions for losses increased $146 million or 12 percent in 2014 as compared to 2013, primarily due to higher average Card Member loans,
a slower improvement in the reserve rate, and the effects of changes in other loss reserve assumptions resulting in a lower reserve release in
2014, partially offset by the benefit of lower net write-offs for Card Member loans due to improved credit performance. Provisions for losses
decreased $3 million in 2013 as compared to 2012.
Refer to Table 11 for the lending and charge card write-off rates for 2014, 2013 and 2012.
EXPENSES
Marketing, promotion, rewards and Card Member services and other expenses increased $476 million or 7 percent in 2014 as compared to
2013, primarily driven by a $397 million or 8 percent increase in Card Member rewards expenses. The increase in rewards costs was driven
by higher co-brand rewards expenses of $203 million, primarily relating to higher spending volumes, and an increase in Membership
Rewards expense of $194 million. The increase in Membership Rewards expense was primarily due to higher new points earned and a higher
WAC per point assumption, including the impact of a $96 million charge related to the Delta partnership renewal in the fourth quarter of
2014.
Salaries and employee benefits and other operating expenses increased $191 million or 5 percent in 2014, as compared to 2013, primarily
driven by higher card-related fraud losses, a change in the estimated value of certain investments in our Community Reinvestment Act
portfolio and higher restructuring charges compared to 2013.
30