American Express 2014 Annual Report Download - page 22
Download and view the complete annual report
Please find page 22 of the 2014 American Express annual report below. You can navigate through the pages in the report by either clicking on the pages listed below, or by using the keyword search tool below to find specific information within the annual report.-
 1
1 -
2
-
3
-
4
-
5
-
6
-
7
-
8
-
9
-
10
-
11
-
 12
12 -
 13
13 -
 14
14 -
 15
15 -
 16
16 -
 17
17 -
 18
18 -
 19
19 -
 20
20 -
 21
21 -
 22
22 -
 23
23 -
 24
24 -
 25
25 -
 26
26 -
 27
27 -
 28
28 -
 29
29 -
 30
30 -
 31
31 -
 32
32 -
33
-
34
-
35
-
36
-
37
-
38
-
39
-
40
-
41
-
42
-
43
-
44
-
45
-
46
-
47
-
48
-
49
-
50
-
51
-
52
-
53
-
54
-
55
-
56
-
57
-
58
-
59
-
60
-
61
-
62
-
63
-
64
-
65
-
66
-
67
-
68
-
69
-
70
-
71
-
72
-
73
-
74
-
75
-
76
-
77
-
78
-
79
-
80
-
81
-
82
-
83
-
84
-
85
-
86
-
87
-
88
-
89
-
90
-
91
-
92
-
93
-
94
-
95
-
96
-
97
-
98
-
99
-
100
-
101
-
102
-
103
-
104
-
105
-
106
-
107
-
108
-
109
-
110
-
111
-
112
-
113
-
114
-
115
-
116
-
117
-
118
-
119
-
120
-
121
-
122
-
123
-
124
-
125
-
126
-
127
-
128
-
129
-
130
 |
 |

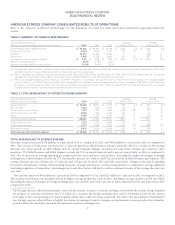
AMERICAN EXPRESS COMPANY
2014 FINANCIAL REVIEW
AMERICAN EXPRESS COMPANY CONSOLIDATED RESULTS OF OPERATIONS
Refer to the “Glossary of Selected Terminology” for the definitions of certain key terms and related information appearing within this
section.
TABLE 2: SUMMARY OF FINANCIAL PERFORMANCE
Years Ended December 31,
(Millions, except percentages and per share amounts) 2014 2013 2012
Change
2014 vs. 2013
Change
2013 vs. 2012
Total revenues net of interest expense $34,292 $ 32,974 $ 31,555 $ 1,318 4 % $ 1,419 4 %
Provisions for losses 2,044 1,832 1,712 212 12 120 7
Expenses 23,257 23,254 23,392 3 — (138) (1)
Net income 5,885 5,359 4,482 526 10 877 20
Earnings per common share – diluted(a) $5.56$ 4.88 $ 3.89 $ 0.68 14 % $ 0.99 25 %
Return on average equity(b) 29.1% 27.8% 23.1%
Return on average tangible common equity(c) 35.9% 34.9% 29.2%
(a) Earnings per common share — diluted was reduced by the impact of earnings allocated to participating share awards and other items of $46 million, $47 million
and $49 million for the years ended December 31, 2014, 2013 and 2012, respectively.
(b) ROE is computed by dividing (i) one-year period net income ($5.9 billion, $5.4 billion and $4.5 billion for 2014, 2013 and 2012, respectively) by (ii) one-year
average total shareholders’ equity ($20.3 billion, $19.3 billion and $19.4 billion for 2014, 2013 and 2012, respectively).
(c) Return on average tangible common equity, a non-GAAP measure, is computedinthesamemannerasROEexceptthe computation of average tangible
common equity, a non-GAAP measure, excludes from average total shareholders’ equity, average goodwill and other intangibles of $3.9 billion, $4.1 billion and
$4.2 billion as of December 31, 2014, 2013 and 2012, respectively, and preferred shares of $0.7 billion as of December 31, 2014. We believe return on average
tangible common equity is a useful measure of the profitability of our business.
TABLE 3: TOTAL REVENUES NET OF INTEREST EXPENSE SUMMARY
Years Ended December 31,
(Millions, except percentages) 2014 2013 2012
Change
2014 vs. 2013
Change
2013 vs. 2012
Discount revenue $19,493 $ 18,695 $ 17,739 $ 798 4 % $ 956 5 %
Net card fees 2,712 2,631 2,506 81 3 125 5
Travel commissions and fees 1,118 1,913 1,940 (795) (42) (27) (1)
Other commissions and fees 2,508 2,414 2,317 94 4 97 4
Other 2,989 2,274 2,425 715 31 (151) (6)
Total non-interest revenues 28,820 27,927 26,927 893 3 1,000 4
Total interest income 7,179 7,005 6,854 174 2 151 2
Total interest expense 1,707 1,958 2,226 (251) (13) (268) (12)
Net interest income 5,472 5,047 4,628 425 8 419 9
Total revenues net of interest expense $ 34,292 $ 32,974 $ 31,555 $ 1,318 4 % $ 1,419 4 %
TOTAL REVENUES NET OF INTEREST EXPENSE
Discount revenue increased $798 million or 4 percent in 2014 as compared to 2013, and $956 million or 5 percent in 2013 as compared to
2012. The increase in both years was driven by a 7 percent growth in billed business volumes, partially offset by a decline in the average
discountrate,fastergrowthinGNSbillingsthaninoverallCompanybillings, and increased cash rebate rewards and corporate client
incentives. U.S. billed business and billed business outside the U.S. increased 8 percent and 6 percent, respectively, in 2014 as compared to
2013, due to increases in average spending per proprietary basic card and basic cards-in-force. Excluding the impact of changes in foreign
exchange rates billed business outside the U.S. increased 10 percent. See Tables 6 and 7 for more detail on billed business performance. The
average discount rate was 2.48 percent, 2.51 percent and 2.52 percent for 2014, 2013 and 2012 respectively. Changes in the mix of spending
by location and industry, volume-related pricing discounts, strategic investments, certain pricing initiatives, competition, pricing regulation
(including regulation of competitors’ interchange rates) and other factors will likely result in continued erosion of the average discount rate
over time.
Net card fees increased $81 million or 3 percent in 2014 as compared to 2013, and $125 million or 5 percent in 2013 as compared to 2012.
The increase in both years was primarily driven by higher average proprietary cards-in-force and higher average card fees in ICS and USCS.
Excluding the impact of changes in foreign exchange rates, net card fees increased 5 percent in 2014 compared to 2013 and 8 percent in 2013
compared to 2012.1
1The foreign currency adjusted information, a non-GAAP measure, assumes a constant exchange rate between the periods being compared
for purposes of currency translation into U.S. dollars (i.e., assumes the foreign exchange rates used to determine results for the current
year apply to the corresponding year period against which such results are being compared).Webelievethepresentationofinformation
on a foreign currency adjusted basis is helpful to investors by making it easier to compare our performance in one period to that of another
period without the variability caused by fluctuations in currency exchange rates.
22